Search Results
Bay Area history reclaimed: The story of 95-year-old artist Janet Bennett and her longstanding tile artworks at 16th and 24th St. stations
Note: Janet Bennett’s tile murals have come to define the character of BART's Mission District stations, and yet, in the fifty-plus years since the tiles were placed, her contribution has gone unattributed...This Women’s History Month, BART is honored to bring forward the story of the artworks as well as that of the wonderful midcentury artist who made them.
BART will be installing plaques at 16th St. Mission and 24th St. Mission stations to recognize Bennett as the artist behind the character-defining murals.
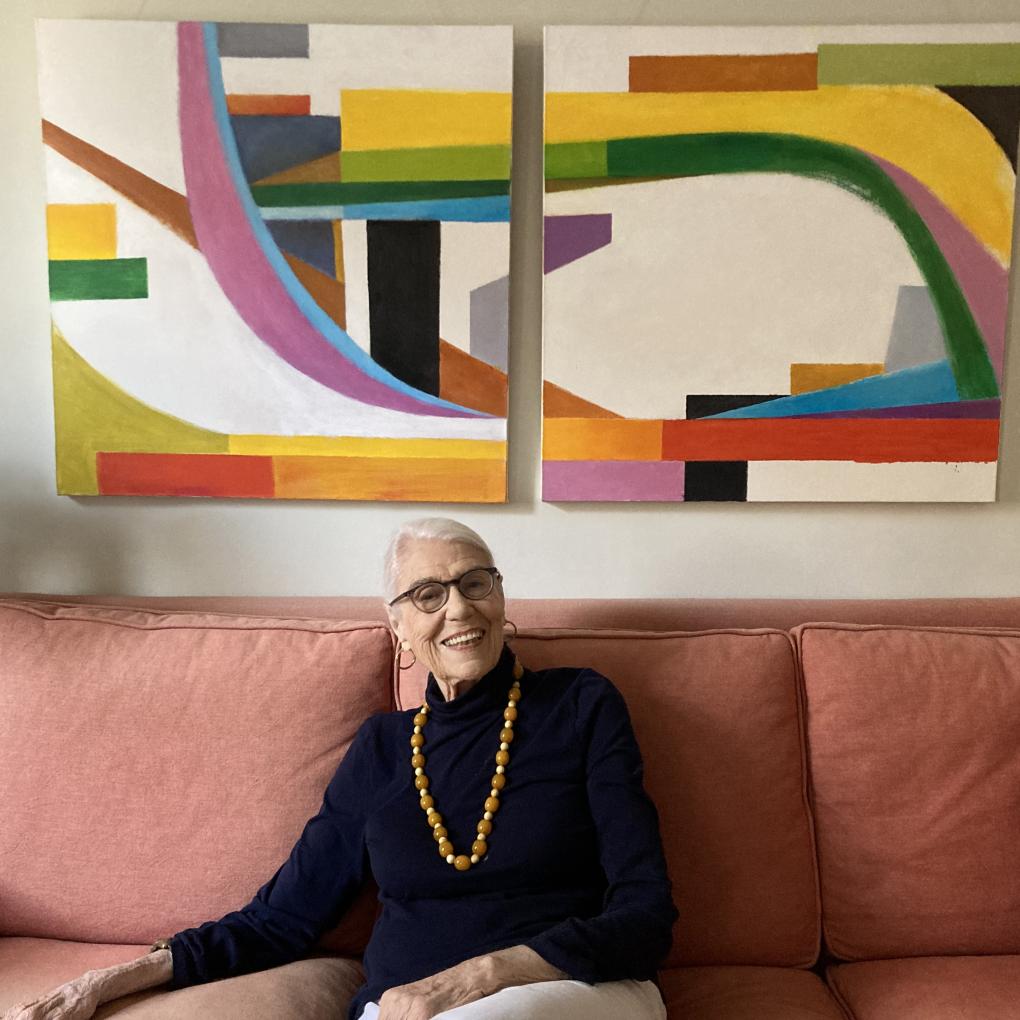
Janet Bennett, the artist behind the tile murals at 16th St. and 24th St. Mission stations, seated in front of one of her paintings in her New York City home.
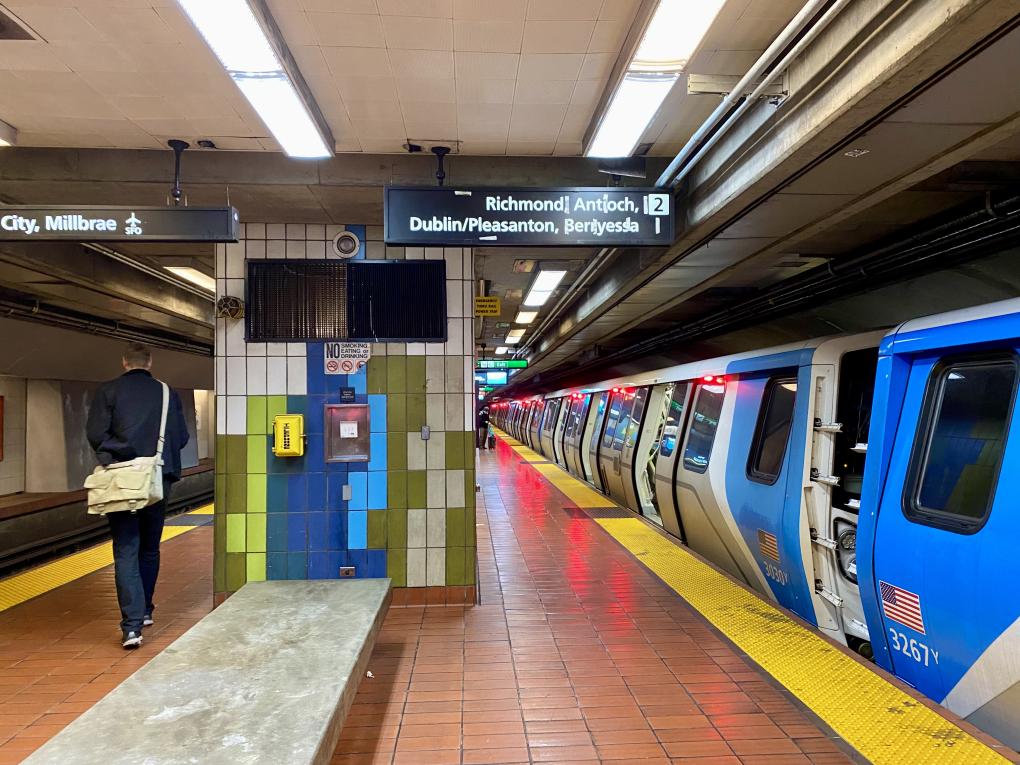
Every day, thousands of people pass through BART’s Mission District stations in San Francisco. As they enter the fare gates, walk along the concourse toward the stairs, then onto the platform to await their trains, they are walking through history.
It’s a history wrought by many hands over more than five decades: the planners who mapped the system, the architects and engineers who drafted the plans, and the workers who sweated day by day to construct a transit space that would function not just during their lifetimes, but the lifetimes of their children, grandchildren, great-grandchildren, and so on.
BART stations serve a practical purpose, of course. But they are not solely utilitarian spaces. Stories are woven into their floors, their trackways, and their walls. These individual components speak together and alone, and if you take a moment to pause and investigate, they might reveal the stories they contain.
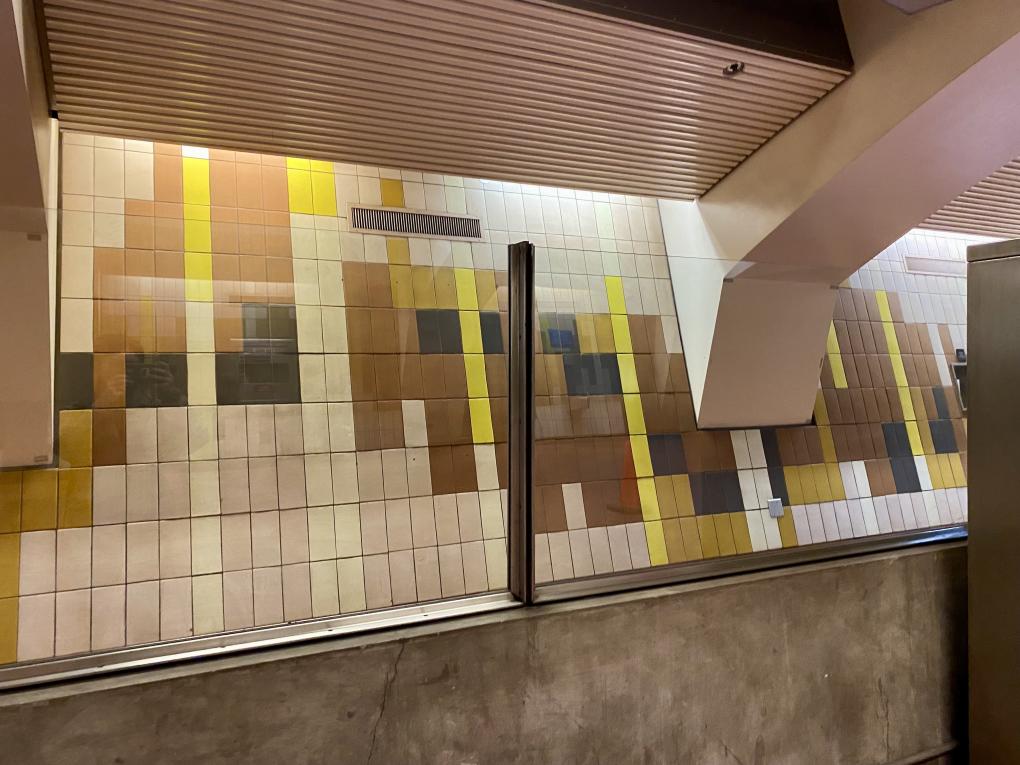
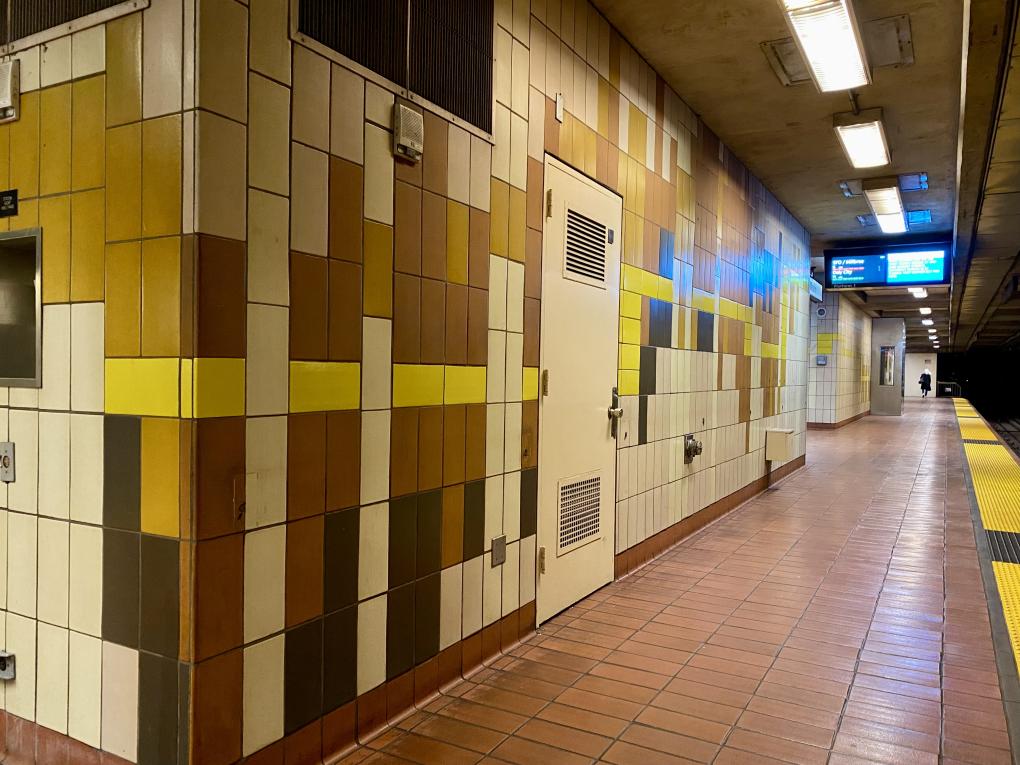
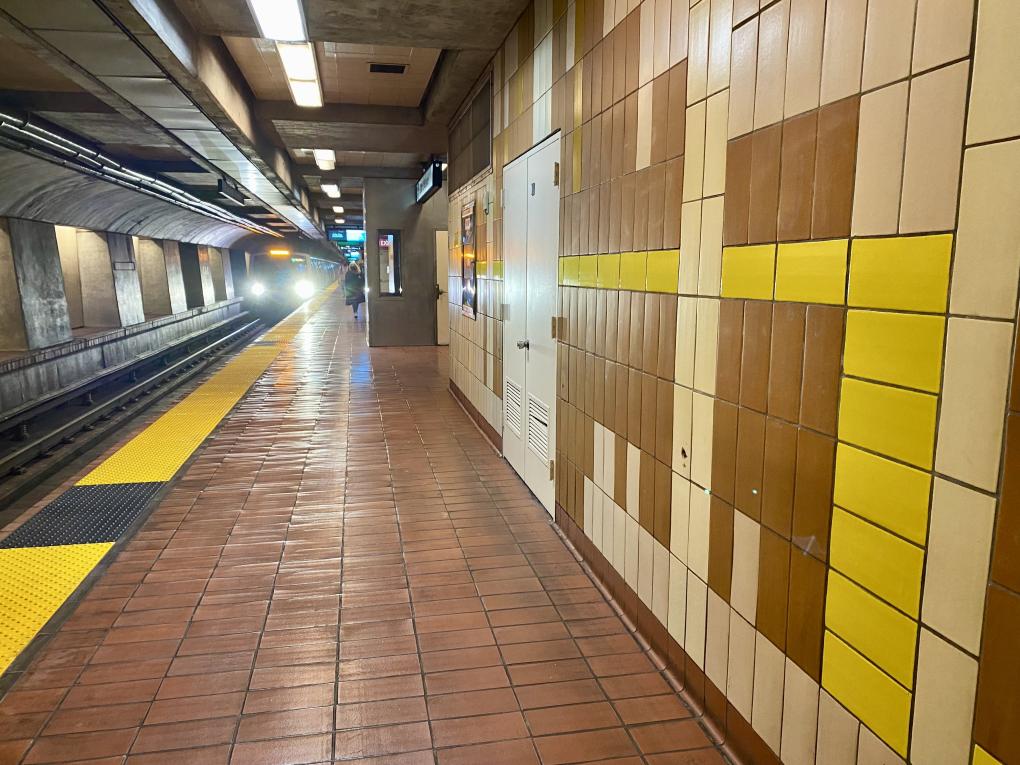
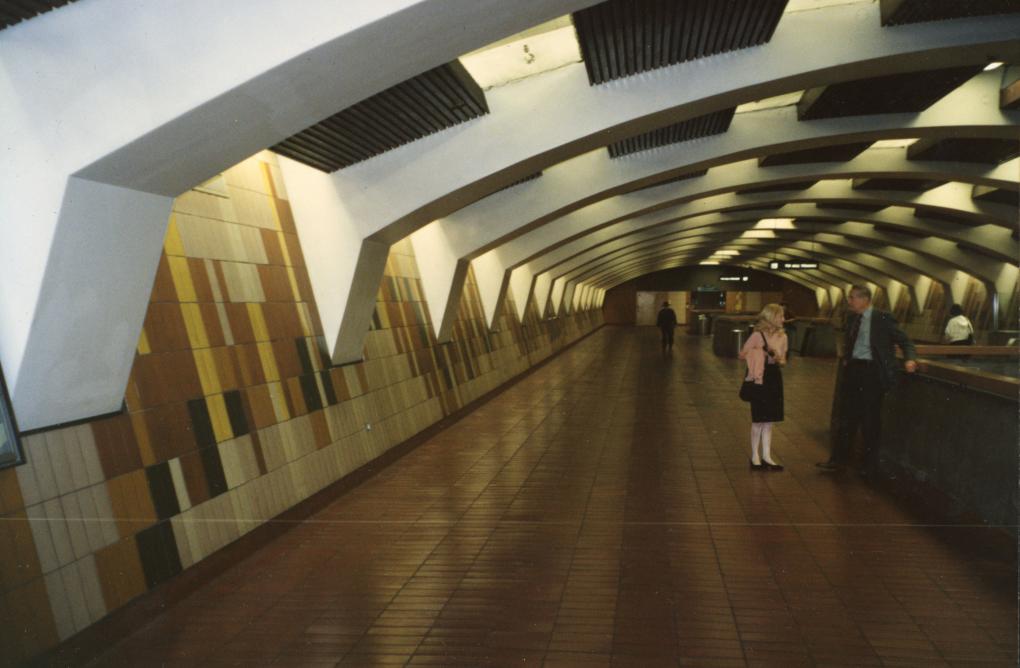
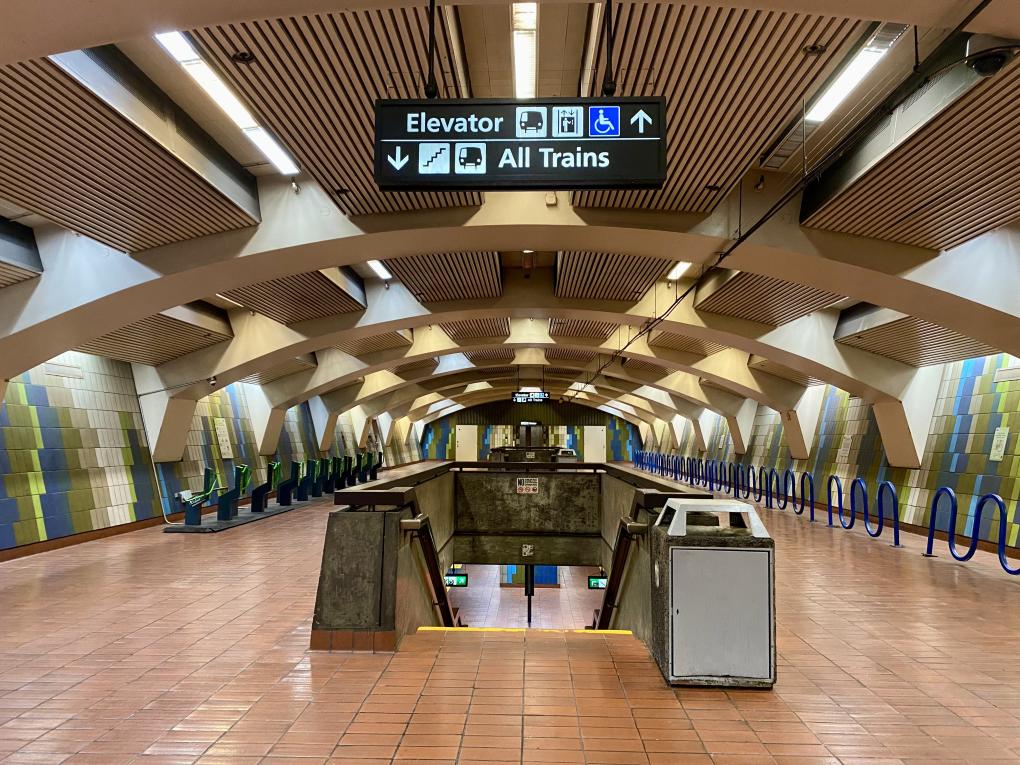
Artist Janet Bennett, now 95 years old and long retired, is a protagonist in the story of 16th St. and 24th St. stations. During the construction of these transit spaces, Bennett was hired by the station architect, Hertzka and Knowles, to design the striking tile murals on the stations' concourse and platform walls. Next time you’re passing through, look around and you’ll find you are surrounded by her tile artworks, from the snaking yellow formations on the platform at 24th St. to the tree-like waves of green and blue that dance on the concourse at 16th St.
“It’s gratifying that these works are still a part of people’s lives,” said Bennett, speaking from her New York City home. “They’ve gone through different lifespans so to speak. I’m happy that my tiles remain and that they’ll be there quite a while longer.”
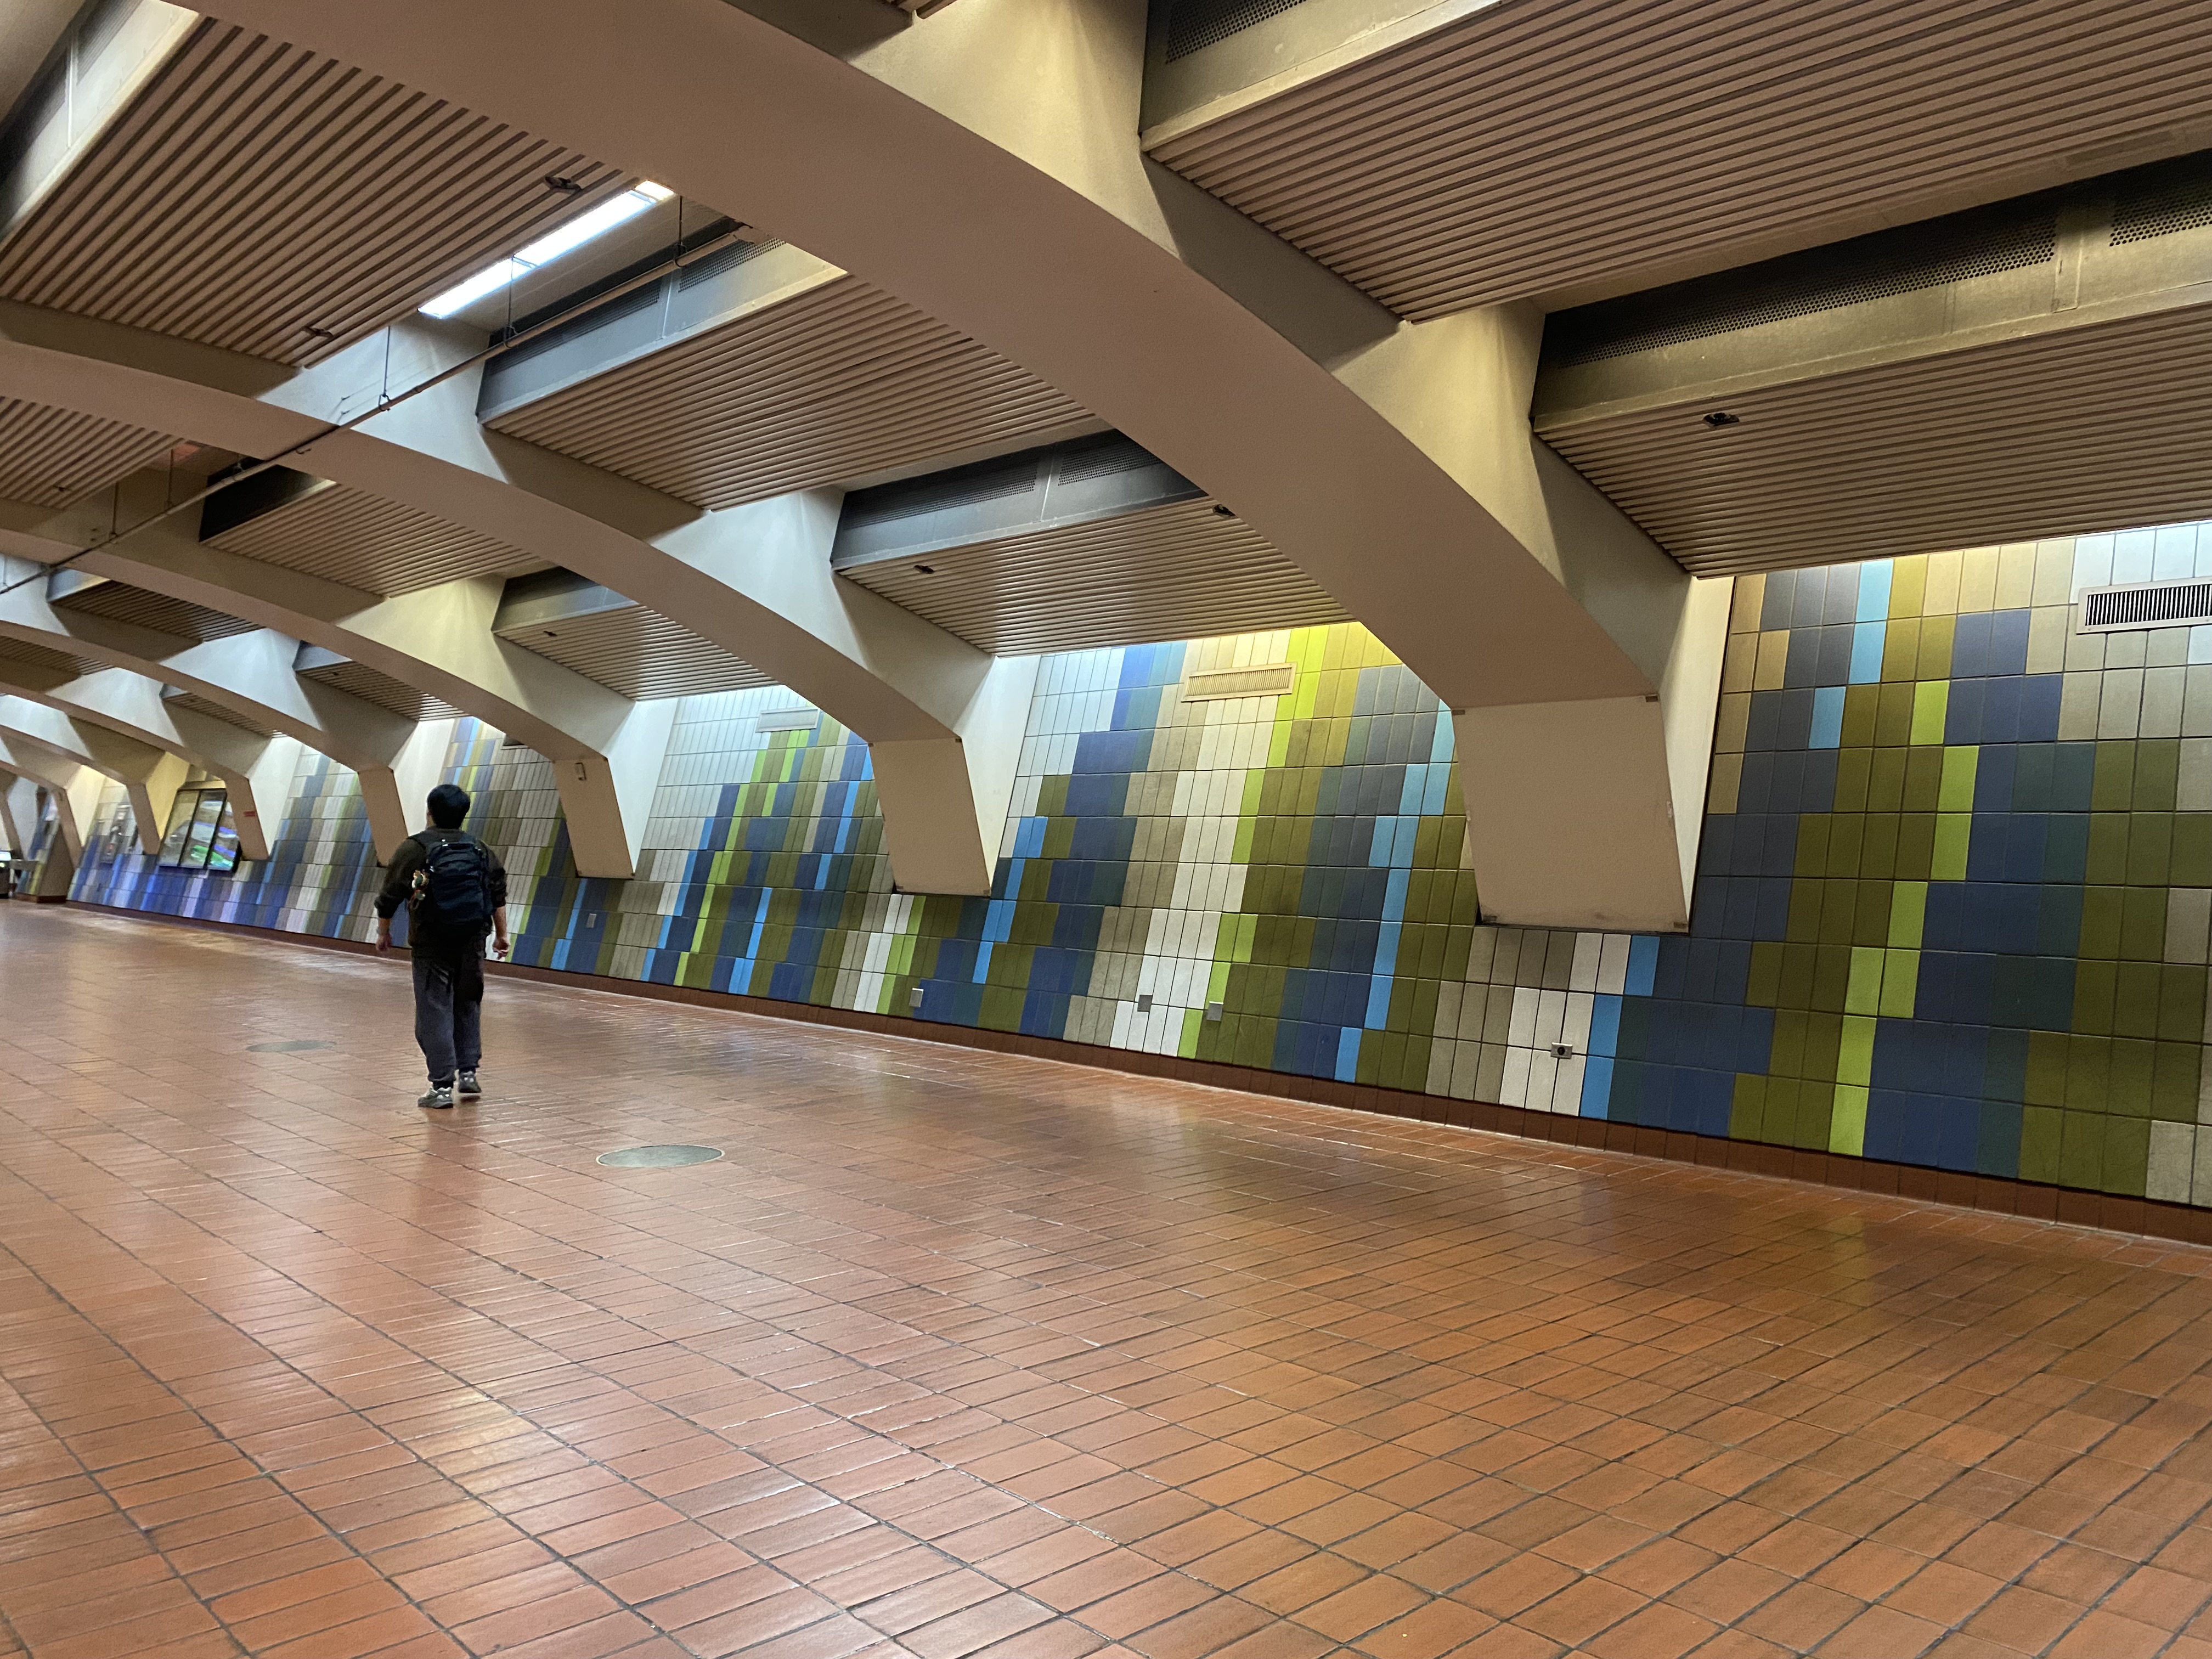
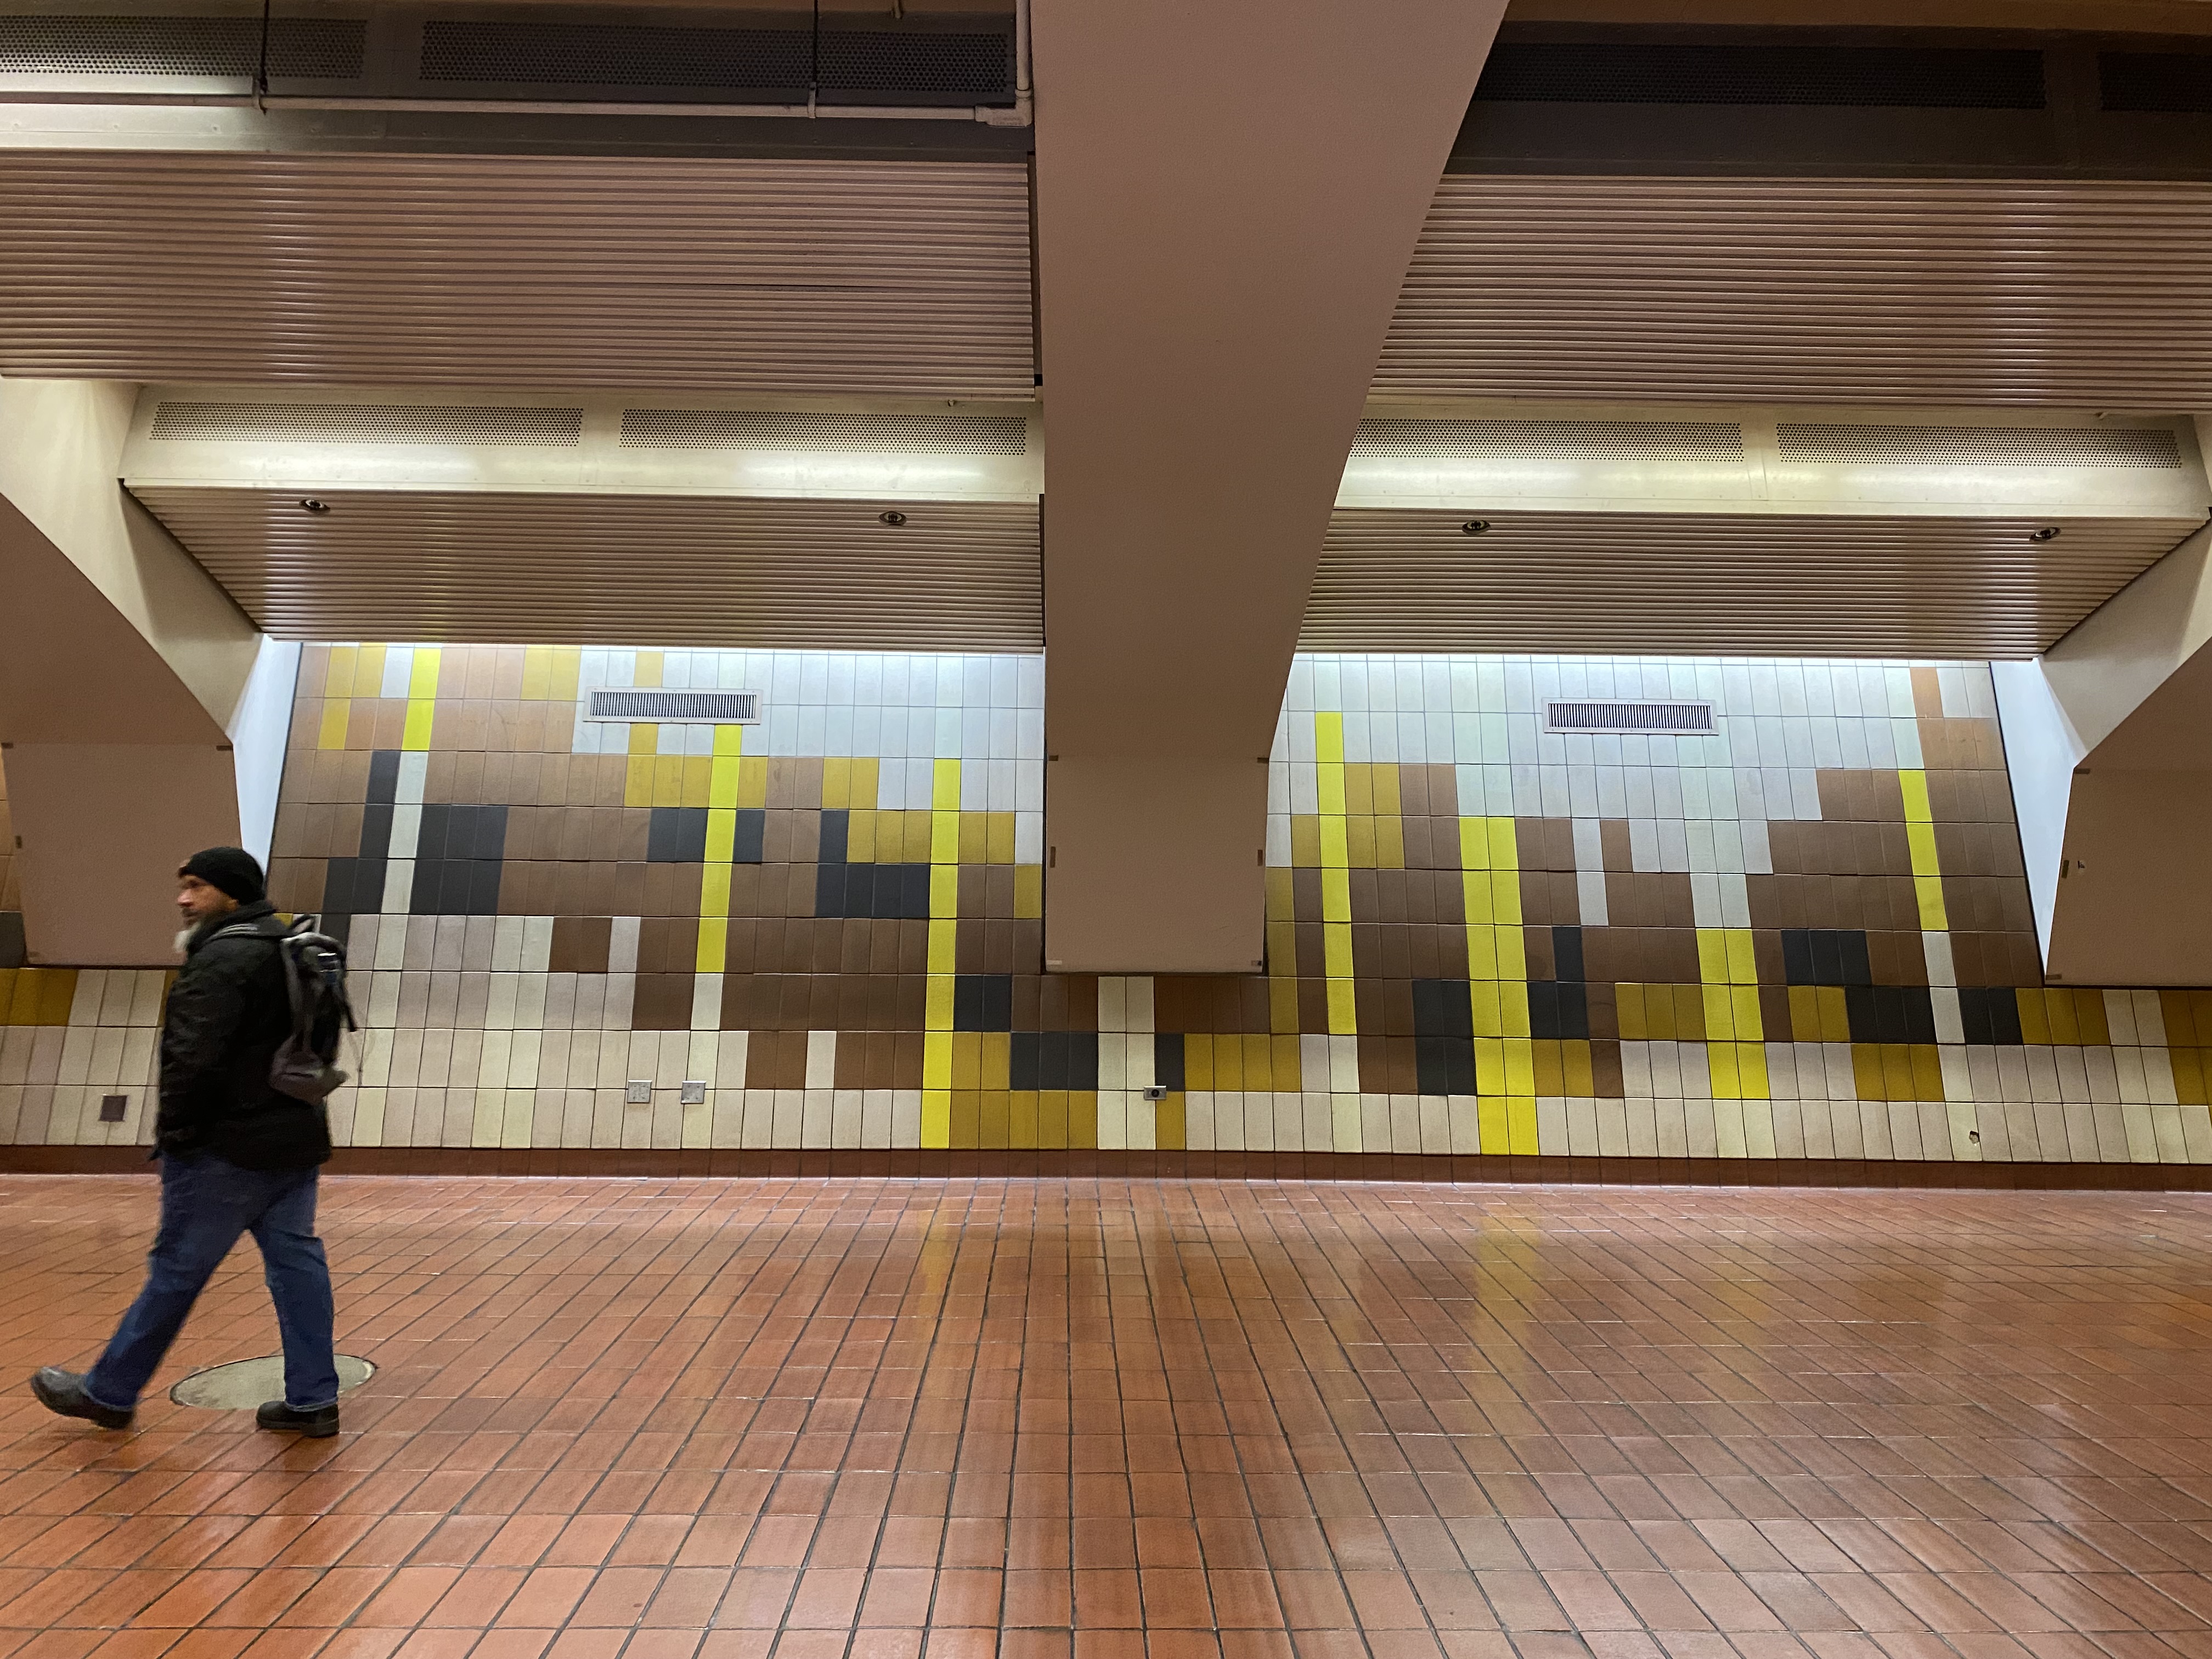
Bennett's tile murals pictured on the concourses at 16th St. (top photo) and 24th St. (bottom photo).
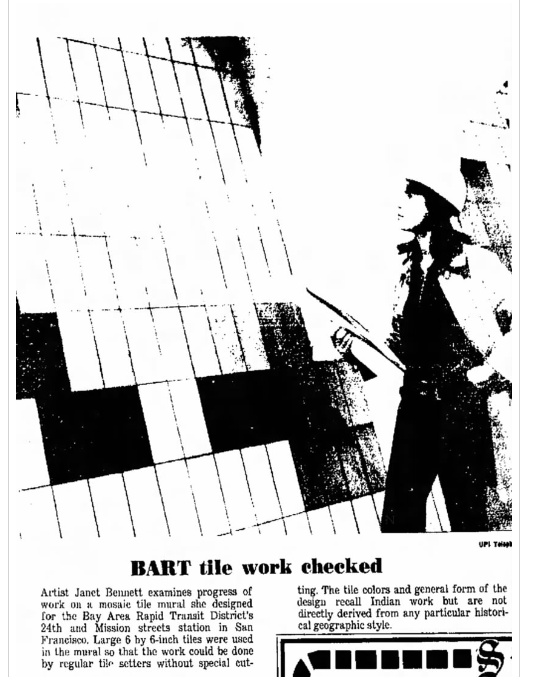
Bennett’s tile murals have come to define the character of the Mission stations, and yet, in the fifty-plus years since the tiles were placed, her contribution has gone unattributed. Said Jennifer Easton, BART’s Art Program Manager: “As a woman and someone who works with artists all the time, it’s so common to see women artists obscured throughout history.” BART learned about Bennett and her connection to the Mission stations after her daughter, Maria McDonald, called BART Customer Services and told them that “my 95-year-old mother named Janet Bennett should be credited as the designer of the ceramic tile artworks at 16th and 24th St. stations.” She added: “It means a lot to her.” BART verified McDonald's claim via 1971 news clippings from local papers.
This Women’s History Month, BART is honored to bring forward the story of the artworks as well as that of the wonderful midcentury artist who made them.
“She really is a creative genius in my estimation,” said McDonald.
When Bennett was working as a staff and consultant for architectural firms and corporations in the 60s and 70s, she “was constantly breaking the glass ceiling and unconsciously taking on the lead in roles usually reserved for men,” her daughter said.
Bennett acknowledged that during that period, she was the only woman working for these major architecture firms outside of the secretarial staff. Even before then, when she was a student at Cranbrook, an art and design school in Michigan, Bennett said “no one expected that I would be anything but an architect’s wife.”
“It didn’t bother me at the time,” she said. “I was just doing my thing.”
(A relevant side note: Bennett also designed the famous mosaic passages at LAX, and her boss at the time, Charles Kratka, was long credited as the artist behind the works. Bennett set the record straight in 2007 after reading an obituary for Kratka that named him as the designer. She is now widely credited as the artist behind the mosaics. The artistic similarities between the LAX murals and the BART works certainly reinforce her claim.)
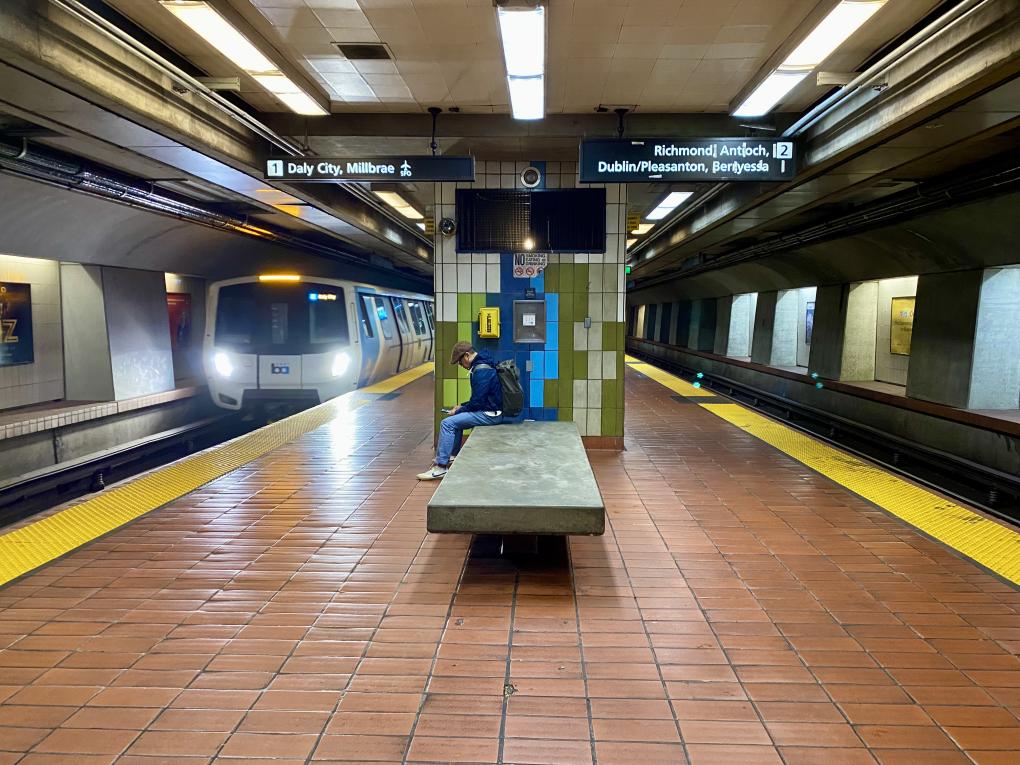
The tile mural at 24th St. Station
When the station architect contacted Bennett about designing the tile murals, she said she was “very, very excited.” Much anticipation and curiosity swirled around this new “Space Age” transit project, and Bennett was intrigued by the idea of leaving her mark on the system.
Upon accepting the assignment, Bennett got to work in her San Francisco studio outlining on paper the concepts for the murals. Once the initial designs were greenlit by the architect, Bennett executed the working drawings, which indicated the placement of every single tile. It was a lengthy and painstaking process.
Bennett said the designs at each station intentionally contrast with one another – there’s the dry, sunny feeling at 24th St. with its terra cottas and yellows and tans, and then the cooler tone of 16th St. with tiles of olive and gray and yellow green.
“One mural is more earthy, while the other is more sylvan,” she said. “Those concepts helped me create the overall program.”
Bennett’s artworks often reference “something from life,” and in many cases, she lets the colors and their relationships to one another inform her pieces. For 24th St., she referenced the vibrant hues of the Mission District and its close cultural ties to Latin America. The horizontal tiles that wrap around the core structures on the platform represent a yellow serpent, she said.
The tile mural at 16th St. Station
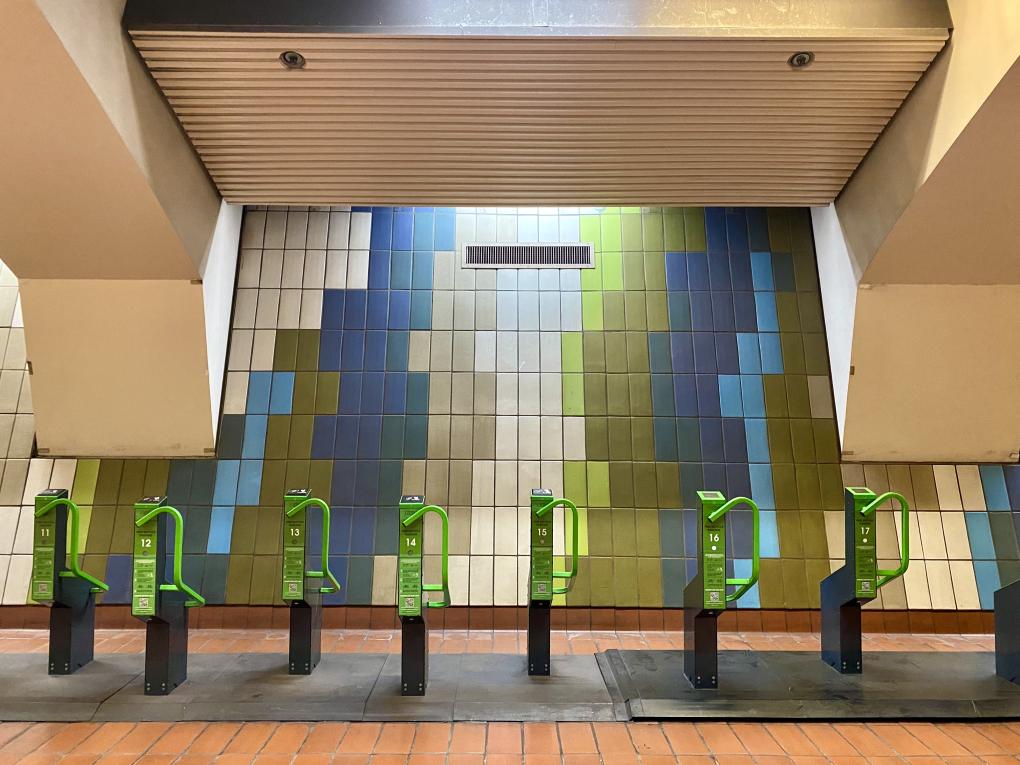
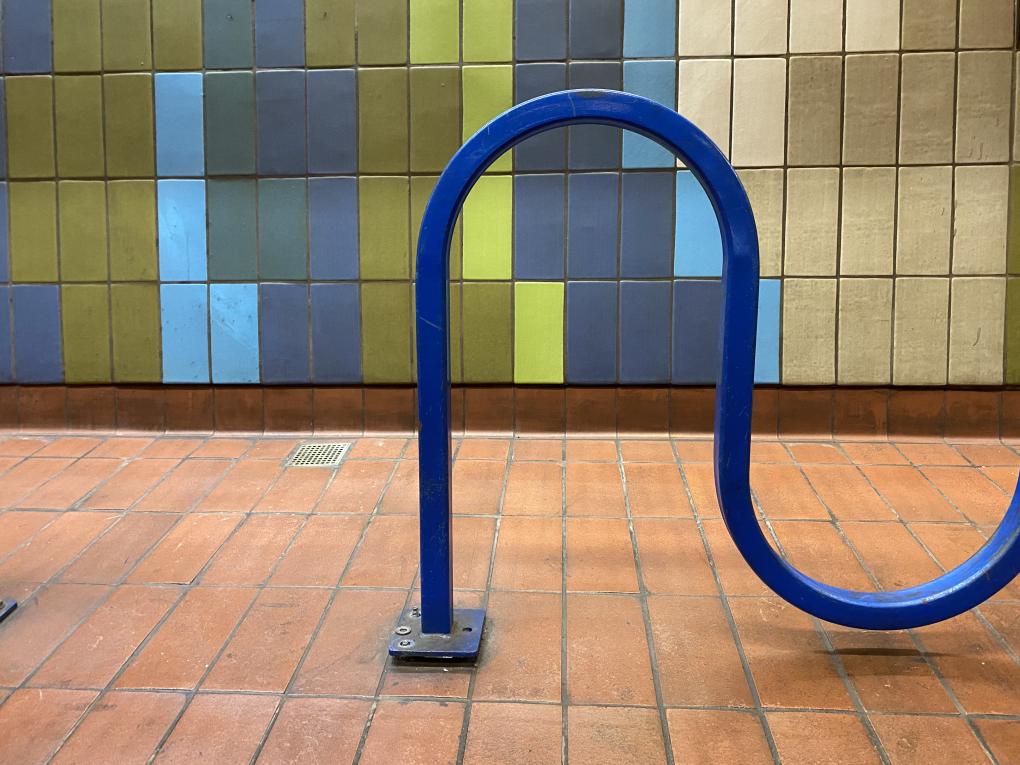
At 16th St., Bennett was influenced by visits to Marin County, its singular “forests, grasslands, and water.”
"Overall, the concern was that the colors worked well together,” Bennett said. “Part of it was motivated by a feeling that I wanted to express."
Bennett frequently traveled to Marin to meet with the tile maker for the project, the historic Heath Ceramics, which was and still is known for its unique glazes and handcrafted tiles. Heath Ceramics was founded by Edith Heath in 1948 in Sausalito, and its architectural tile line had gained acclaim with many architects throughout California by the time Bennett was working in the industry. Bennett said she collaborated closely with Heath to create the color palette for the BART station tile glazes, which she believes were custom made for the project.
Ceramic tiles are expensive, but you will notice that many BART stations incorporate them. That's because the material is durable, easy to clean, and conveys a sense of handcraftmanship, much like the use of wood, unique concretes, marble, and other unique architectural finishes used in the early BART stations. Bennett’s longstanding tile murals are a testament to the durability and timelessness of these materials.
The large ten-inch tiles Bennett used for her project added to its cost, she said. Because they were so large, the tiles sometimes warped during the firing process and had to be tossed out.
The architects of the stations also had something of a bone to pick with Bennett’s decision to use a horizontal tile layout on the core structures of the platform at 24th St.
“The architects said the horizontal tiles complicated the overall layout, and therefore were too time-consuming and costly to use. They said I should change my working drawings,” Bennett said. “I countered that it would cost more to redraw them."
“So,” she said triumphantly, “the horizontal tiles remain.”
After perfecting the drawings and selecting the last tiles, Bennett finally handed the project to the tile layers. The workers installed the tiles one at a time with special care and attention. Their skilled work in tandem with Bennett’s amaranthine designs has ensured that these murals will remain for many years to come.

A portrait of the artist.
Bennett has left a mark on many public spaces, including those in the Bay Area where she lived for a time. She said she created works for a variety of local institutions: metal mobiles for the Ice House, a longstanding set of buildings in San Francisco’s Waterfront District; an illuminated acrylic and steel sculpture for Memorex, considered to be one of Silicon Valley’s first tech startups; and even a stage set for a San Francisco Opera gala.
Back in the 60s and 70s, Bennett said her artworks were mostly considered “decorative” because of their functional usage in architectural settings. She thinks the term demeans her work and its artistic value.
“I didn’t think of my work as merely decorative,” she said. “Heck, [by that definition] Michelangelo ‘decorated’ the Sistine Chapel. It’s applied art made to enhance a space and give dignity to it."
Many of Bennett’s artworks have disappeared in time, just like the buildings and businesses that housed them. But she recognizes that "often art is here one day and gone the next.”
“Artwork has its moment,” she said, “and sometimes that’s it. But artwork as part of architecture can exist for centuries.”
Though Bennett’s art practice mostly consists of painting these days, she says she’d consider taking on another mural commission if the right project came along.
“If somebody contacts me because of this article, I could certainly do this type of work again,” she said. “I don’t have the strength to set the tiles, but I certainly have the strength to design some murals.”
Entrance Closure Alert: Embarcadero Davis at Market Streets
September 6 update:
The closure has been extended to Sunday, September 15 due to unforeseen complications. We thank you for your patience.
----------------------------------------------------------------------------------------------------------------------------------------
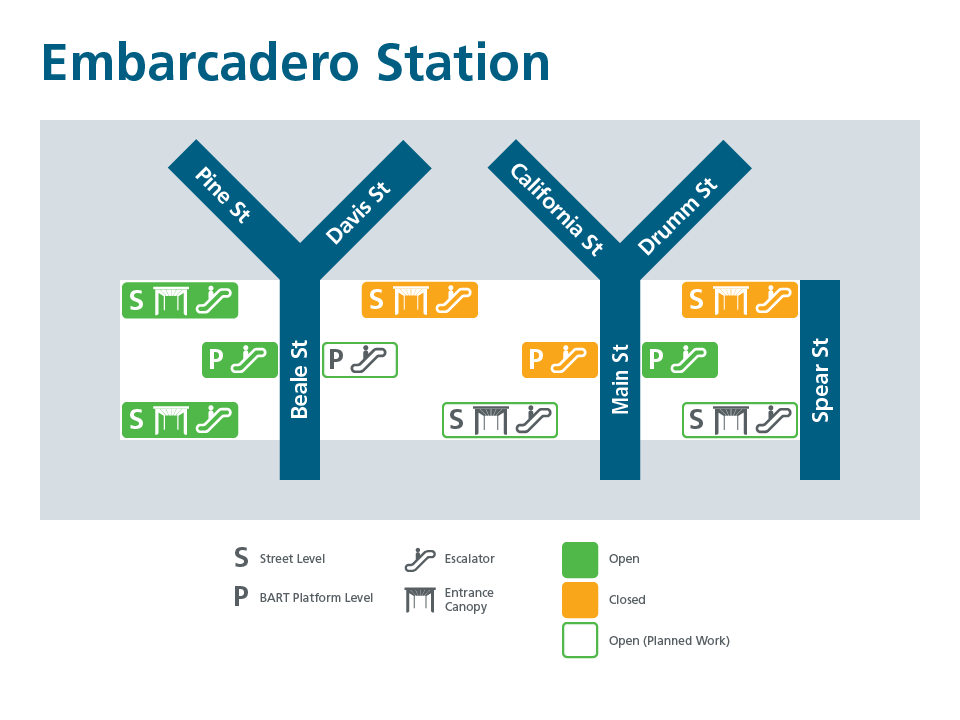
BART’s escalator contractor will close the Embarcadero Station entrance located at Davis and Market (stairway and escalator) this Friday, August 30 to Sunday, September 8. This full entrance closure is necessary to complete installation of panels at the entrance.
Please note there will be two entrance closures at the Embarcadero Station during this 10-day period. A map below shows the open entrances and elevator location. Wayfinding signs will be installed on the barricades inside the station and on the street level to detour pedestrian traffic from this entrance.
BART crews are busy working on the single largest contract for escalator replacement in BART history. The Market Street Escalators Renovation Project team is working to install and replace 41 escalators at Embarcadero, Montgomery, Powell, and Civic Center stations. Of the escalators to be replaced, 23 are street to concourse level and 18 connect concourse with station platforms. Project completion is expected to be in 2026. You can view the four downtown station maps for escalator and canopy progress at: https://www.bart.gov/about/planning/sf-escalators
Installation work to begin Friday, April 18 for Next Generation Fare Gates at Lake Merritt Station
The installation of Next Generation Fare Gates is scheduled to begin Friday, April 18 at Lake Merritt Station.
The installation process is expected to take approximately two weeks to complete for each of the station’s two sets of gates, which are on opposite sides of the station. During construction, there will be a barrier installed around the set of gates being replaced and along a path to travel to the opposite set of gates. There will be a 3’ x 6’ rug at each end of the path. The first set of faregates to close will be closest to the west side entrance, near 8th Street. The second phase will close the east side gates near 9th Street. There will be signage and additional BART staff to direct riders to the open gates.
The work will not affect train service, but riders may experience a few extra minutes wait to pass through the fare gates during peak travel hours.
The latest work comes after BART has successfully installed Next Generation Fare Gates at 25 other stations across the system. All 50 BART stations will have new fare gates by the end of 2025. You can learn more about BART’s Next Generation Fare Gate project here.

Hewitt Collection of African American Art Featured at MoAD
"Art enriches life, enlarges life, expands life." So said Vivian Hewitt, the remarkable woman who with her late husband, John Hewitt, assembled one of the nation's most significant collections of African-American art. The Hewitt Collection of African American Art is on display from Oct. 17 through Jan. 11 at
Projects & Plans
Civic Center Station: one week stairway closure at UN Plaza entrance April 7-10
UPDATE April 8, 2026:
Crews were able to complete the work sooner than anticipated, so this entrance was re-opened early afternoon on Tuesday, April 7, 2026.
From April 7 through April 10, riders will not be able to enter the station from the UN Plaza entrance as the contractor installs fencing around the escalator. The escalator going up from the station will remain in service, allowing riders to exit the station. Signs at the top of the closed escalator will guide customers to an alternate entrance.
Riders should use the following options to access the Civic Center station during this period:
North Side of Market Street – Stairway Access
- Stair-only Entrance in front of Orpheum Theatre
- Stair-only Entrance at 7th Street @ Charles J. Brenham Place
North Side of Market Street – Elevator Access
- Elevator at UN Plaza
South Side of Market Street - Stairway / Escalator Access
- 8th & Market Canopy Entrance – Entrance has both stairway and escalator
- Mid-Block Stair-only Entrance
- 7th & Market Street – Entrance has both stairway and escalator
Status of the Escalator Project
There are two escalator units located above the Civic Center Station that serve the United Nations Plaza on the north side of Market Street. The BART Escalator Renovation Project contractor plans to complete the replacement of the first of the two units in early April and expects to start replacement of the second unit soon after that. All work at the Civic Center / UN Plaza entrance is expected to be completed by October 2026.
BART’s Escalator Renovation Project is replacing 44 escalator units (40 BART plus 4 additional MUNI escalators) in the four downtown stations at both platform and street levels. To date, BART has completed installation of 26 units, 1 is currently under construction, and there are 17 remaining escalator units to be completed through January 2029.
Thank you for your patience as we work to complete this important escalator renovation project.
For more information on this project visit: bart.gov/about/planning/sfentrances
Single Tracking Alert: Service to be reduced to one track between Balboa Park and Daly City for tree removal work (final Sunday workday cancelled)
Update 10:00am, September 13:
The final Sunday of scheduled work for this project between Balboa Park and Daly City has been cancelled. BART will now run its normal service on Sunday, September 24 instead of reducing service to one track.
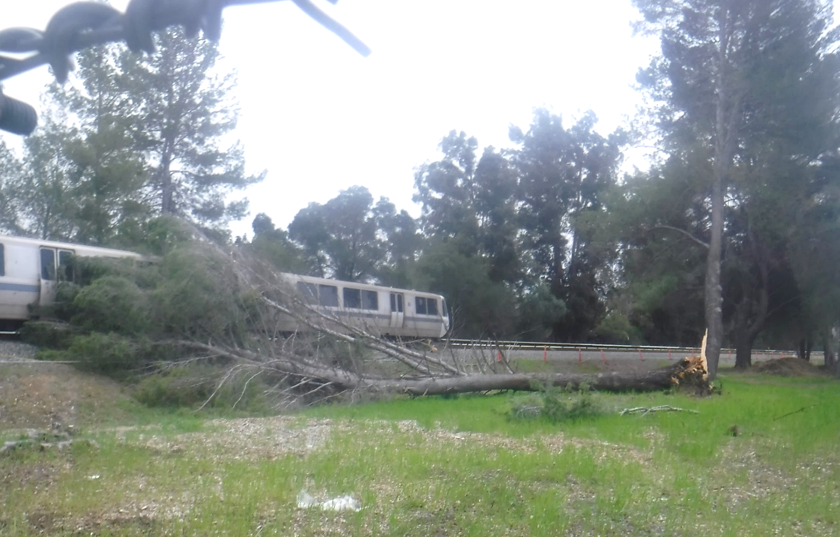
On three non-consecutive Sundays in August and September BART will be cutting back and removing trees that could pose a hazard to the trackway between Balboa Park and Daly City stations. To ensure safe conditions for workers, service will be reduced from two to one track on the following Sundays:
*August 27
*September 10
*September 24
Riders in the area on those workdays should anticipate delays of 10-15 minutes. Also, all Green Line trains will be cancelled.
On those three dates BART will also perform tree removal work in southern Alameda County. That work will happen on both Saturdays and Sundays on those three weekends and will require free buses to replace train service between Union City and Fremont stations. You can learn more about the work in Alameda County here. You can also get more details about BART’s systemwide safety initiative to remove potentially hazardous trees at the project page.
Installation work to begin December 13 for Next Generation Fare Gates at Dublin/Pleasanton Station
Installation of Next Generation Fare Gates is scheduled to begin December 13 at Dublin/Pleasanton Station. The installation process is expected to take approximately two weeks to complete.
During construction, there will be a barrier around the existing station gate array. Riders will use two temporary accessible gates to enter and exit. The temporary gates are located at each end of the station entrance. The gate to exit the station will be next to the Station Agent Booth and the gate to enter the station will be on the far left at the end of the existing array against the wall. There will be signage and additional staff to help direct riders through the temporary gates. Additionally, a carpet will be installed immediately before the entrance to each temporary gate, to make them easier to locate for riders with visual impairments.
The work will not impact train service, but riders may experience a few minutes wait to pass through the temporary gates during peak travel hours.
This latest work follows the successful installation of new fare gates at 11 BART stations across the system. All BART stations will have new gates by the end of 2025. You can learn more about BART’s Next Generation Fare Gates at our project page. Riders can provide feedback about the new gates at bart.gov/comments.
Installation work to begin December 13 for Next Generation Fare Gates at Hayward Station
Installation of Next Generation Fare Gates is scheduled to begin December 13 at Hayward Station. The installation process is expected to take approximately two weeks to complete.
During construction, there will be a barrier around the existing station gate array. Riders will use two temporary accessible gates to enter and exit Hayward Station. Both gates are located next to the Station Agent Booth. When facing the booth from the non-paid area of the station, the fare gate to your right is used to enter the station and the fare gate to your left is used to exit. Additionally, a carpet will be installed immediately before the entrance to each temporary gate to make the gates easier to locate for riders with visual impairments.
The work will not impact train service, but riders may experience a few extra minutes wait to pass through the fare gates during peak travel hours.
The latest work comes after BART has successfully installed Next Generation Fare Gates at 11 other stations across the system. All 50 BART stations will have new fare gates by the end of 2025. You can learn more about BART’s Next Generation Fare Gate at the project page. Riders can provide feedback about the new gates at bart.gov/comments.
Installation work to begin the week of September 3rd for Next Generation Fare Gates at Richmond Station
Installation of Next Generation Fare Gates is scheduled to begin the week of September 3rd at Richmond Station. The installation process is expected to take approximately two weeks to complete. This work comes after the successful installation of Next Generation Fare Gates at Civic Center, Fruitvale, and West Oakland stations.
During construction, there will be a barrier around the existing station gate array. Riders will use two temporary accessible gates to enter and exit Richmond Station. Both gates are located next to the Station Agent Booth. When facing the booth from the non-paid area of the station, the fare gate to your right is used to enter the station and the fare gate to your left is used to exit. Additionally, carpet will be installed immediately before the entrance to each fare gate, to make these two gates easier to locate for riders with visual impairments. The removal of the old gates and installation of Next Generation Fare Gates will not impact train service.
All BART stations will have new fare gates by the end of 2025. You can learn more about BART’s Next Generation Fare Gate project at bart.gov/about/projects/fare-gate. Riders can provide feedback about the new gates at bart.gov/comments.