Archived Ridership Watch and BART's COVID-19 Response Efforts from 2020-2022
Since March 2020, BART Communications Department has been recording daily ridership figures and all efforts BART has taken to respond during the COVID-19 global pandemic.
This page is an archive of all tables, figures and daily updates BART has provided from March 9, 2020 until December 31, 2022.
To visit the Ridership Watch page for the year 2023, please click here.
| November | December | ||||
|---|---|---|---|---|---|
| Date | Actual | % of baseline | Date | Actual | % of baseline |
| 11/1/22 | 153,067 | 37% | 12/1/22 | 134,933 | 35% |
| 11/2/22 | 162,527 | 40% | 12/2/22 | 137,190 | 35% |
| 11/3/22 | 165,662 | 40% | 12/3/22 | 71,682 | 46% |
| 11/4/22 | 140,993 | 34% | 12/4/22 | 58,039 | 54% |
| 11/5/22 | 82,072 | 56% | 12/5/22 | 129,902 | 33% |
| 11/6/22 | 61,767% | 56% | 12/6/22 | 158,307 | 41% |
| 11/7/22 | 137,459 | 33% | 12/7/22 | 162,051 | 42% |
| 11/8/22 | 143,478 | 35% | 12/8/22 | 158,310 | 41% |
| 11/9/22 | 163,503 | 40% | 12/9/22 | 138,092 | 35% |
| 11/10/22 | 165,654 | 40% | 12/10/22 | 69,515 | 44% |
| 11/11/22 | 120,746 | 63% | 12/11/22 | 55,914 | 52% |
| 11/12/22 | 84,862 | 58% | 12/12/22 | 128,205 | 33% |
| 11/13/22 | 60,370 | 58% | 12/13/22 | 153,707 | 39% |
| 11/14/22 | 137,367 | 33% | 12/14/22 | 154,978 | 40% |
| 11/15/22 | 163,750 | 40% | 12/15/22 | 157,625 | 40% |
| 11/16/22 | 164,229 | 40% | 12/16/22 | 132,249 | 34% |
| 11/17/22 | 164,060 | 40% | 12/17/22 | 84,331 | 54% |
| 11/18/22 | 139,653 | 34% | 12/18/22 | 60,208 | 56% |
| 11/19/22 | 92,247 | 63% | 12/19/22 | 115,576 | 30% |
| 11/20/22 | 60,109 | 58% | 12/20/22 | 132,930 | 34% |
| 11/21/22 | 124,864 | 30% | 12/21/22 | 129,683 | 33% |
| 11/22/22 | 135,905 | 33% | 12/22/22 | 117,884 | 30% |
| 11/23/22 | 116,266 | 28% | 12/23/22 | 101,445 | 26% |
| 11/24/22 | 37,870 | 20% | 12/24/22 | 53,575 | 34% |
| 11/25/22 | 83,011 | 20% | 12/25/22 | 28,985 | 21% |
| 11/26/22 | 72,494 | 50% | 12/26/22 | 57,942 | 15% |
| 11/27/22 | 54,646 | 53% | 12/27/22 | 84,672 | 22% |
| 11/28/22 | 127,454 | 31% | 12/28/22 | 107,725 | 28% |
| 11/29/22 | 152,873 | 37% | 12/29/22 | 89,248 | 23% |
| 11/30/22 | 154,377 | 38% | 12/30/22 | 84,269 | 22% |
| 12/31/22 | 53,686 | 50% |
| September | October | ||||
|---|---|---|---|---|---|
| Date | Actual | % of baseline | Date | Actual | % of baseline |
| 9/1/22 | 159,373 | 37% | 10/1/22 | 98,212 | 61% |
| 9/2/22 | 138,449 | 32% | 10/2/22 | 69,983 | 63% |
| 9/3/22 | 90,241 | 59% | 10/3/22 | 143,444 | 34% |
| 9/4/22 | 76,116 | 70% | 10/4/22 | 167,847 | 39% |
| 9/5/22 | 60,234 | 56% | 10/5/22 | 170,738 | 40% |
| 9/6/22 | 151,382 | 36% | 10/6/22 | 166,889 | 39% |
| 9/7/22 | 163,324 | 38% | 10/7/22 | 148,858 | 35% |
| 9/8/22 | 165,195 | 39% | 10/8/22 | 107,424 | 66% |
| 9/9/221 | 144,629 | 34% | 10/9/22 | 79,234 | 71% |
| 9/10/22 | 94,820 | 62% | 10/10/22 | 117,158 | 33% |
| 9/11/22 | 65,371 | 60% | 10/11/22 | 166,468 | 39% |
| 9/12/22 | 142,871 | 34% | 10/12/22 | 167,033 | 39% |
| 9/13/22 | 170,373 | 40% | 10/13/22 | 165,308 | 39% |
| 9/14/22 | 181,788 | 43% | 10/14/22 | 144,308 | 34% |
| 9/15/22 | 169,995 | 40% | 10/15/22 | 86,432 | 53% |
| 9/16/22 | 147,774 | 35% | 10/16/22 | 58,169 | 52% |
| 9/17/22 | 97,045 | 63% | 10/17/22 | 138,891 | 33% |
| 9/18/22 | 54,741 | 51% | 10/18/22 | 169,918 | 40% |
| 9/19/22 | 143,937 | 34% | 10/19/22 | 168,686 | 40% |
| 9/20/22 | 174,057 | 41% | 10/20/22 | 168,306 | 40% |
| 9/21/22 | 176,506 | 41% | 10/21/22 | 145,517 | 34% |
| 9/22/22 | 177,358 | 42% | 10/22/22 | 87,833 | 54% |
| 9/23/22 | 140,305 | 33% | 10/23/22 | 64,663 | 58% |
| 9/24/22 | 99,626 | 65% | 10/24/22 | 136,134 | 32% |
| 9/25/22 | 73,980 | 68% | 10/25/22 | 164,520 | 39% |
| 9/26/22 | 141,544 | 33% | 10/26/22 | 165,668 | 39% |
| 9/27/22 | 170,256 | 40% | 10/27/22 | 166,477 | 39% |
| 9/28/22 | 172,295 | 40% | 10/28/22 | 140,658 | 33% |
| 9/29/22 | 170,211 | 40% | 10/29/22 | 91,855 | 57% |
| 9/30/22 | 153,332 | 36% | 10/30/22 | 61,583 | 55% |
| 10/31/22 | 130,230 | 31% |
| July | August | ||||
|---|---|---|---|---|---|
| Date | Actual | % of baseline | Date | Actual | % of baseline |
| 7/1/22 | 123,370 | 30% | 8/1/22 | 122,881 | 30% |
| 7/2/22 | 77,333 | 49% | 8/2/22 | 143,839 | 35% |
| 7/3/22 | 60,912 | 57% | 8/3/22 | 145,258 | 35% |
| 7/4/22 | 61,609 | 45% | 8/4/22 | 147,812 | 36% |
| 7/5/22 | 124,095 | 30% | 8/5/22 | 134,628 | 32% |
| 7/6/22 | 137,052 | 33% | 8/6/22 | 93,947 | 60% |
| 7/7/22 | 135,560 | 33% | 8/7/22 | 73,068 | 71% |
| 7/8/22 | 123,809 | 30% | 8/8/22 | 122,450 | 30% |
| 7/9/22 | 79,350 | 50% | 8/9/22 | 145,652 | 35% |
| 7/10/22 | 60,609 | 57% | 8/10/22 | 147,210 | 35% |
| 7/11/22 | 122,995 | 30% | 8/11/22 | 144,980 | 35% |
| 7/12/22 | 145,279 | 35% | 8/12/22 | 132,008 | 32% |
| 7/13/22 | 145,043 | 35% | 8/13/22 | 84,889 | 54% |
| 7/14/22 | 144,092 | 35% | 8/14/22 | 66,211 | 64% |
| 7/15/22 | 126,737 | 31% | 8/15/22 | 126,944 | 31% |
| 7/16/22 | 83,108 | 53% | 8/16/22 | 148,889 | 36% |
| 7/17/22 | 60,271 | 56% | 8/17/22 | 151,381 | 37% |
| 7/18/22 | 119,572 | 29% | 8/18/22 | 155,066 | 37% |
| 7/19/22 | 139,269 | 34% | 8/19/22 | 137,325 | 33% |
| 7/20/22 | 141,088 | 34% | 8/20/22 | 88,994 | 57% |
| 7/21/22 | 145,462 | 35% | 8/21/22 | 61,095 | 59% |
| 7/22/22 | 122,926 | 30% | 8/22/22 | 132,599 | 32% |
| 7/23/22 | 83,212 | 53% | 8/23/22 | 156,589 | 38% |
| 7/24/22 | 62,716 | 58% | 8/24/22 | 156,797 | 38% |
| 7/25/22 | 120,450 | 29% | 8/25/22 | 158,309 | 38% |
| 7/26/22 | 145,539 | 35% | 8/26/22 | 137,183 | 33% |
| 7/27/22 | 143,217 | 35% | 8/27/22 | 88,791 | 57% |
| 7/28/22 | 143,962 | 35% | 8/28/22 | 61,428 | 60% |
| 7/29/22 | 127,926 | 31% | 8/29/22 | 133,945 | 32% |
| 7/30/22 | 78,366 | 50% | 8/30/22 | 155,141 | 37% |
| 7/31/22 | 58,169 | 54% | 8/31/22 | 161,236 | 39% |
| May | June | ||||
|---|---|---|---|---|---|
| Date | Actual | % of baseline | Date | Actual | % of baseline |
| 5/1/22 | 59,730 | 58% | 6/1/22 | 138,957 | 34% |
| 5/2/22 | 120,042 | 29% | 6/2/22 | 137,639 | 33% |
| 5/3/22 | 147,129 | 36% | 6/3/22 | 126,954 | 31% |
| 5/4/22 | 143,065 | 35% | 6/4/22 | 78,815 | 51% |
| 5/5/22 | 145,300 | 35% | 6/5/22 | 56,266 | 47% |
| 5/6/22 | 134,613 | 33% | 6/6/22 | 122,394 | 30% |
| 5/7/22 | 86,384 | 60% | 6/7/22 | 144,582 | 35% |
| 5/8/22 | 57,199 | 55% | 6/8/22 | 145,882 | 35% |
| 5/9/22 | 122,848 | 30% | 6/9/22 | 137,856 | 33% |
| 5/10/22 | 141,364 | 34% | 6/10/22 | 133,259 | 32% |
| 5/11/22 | 142,598 | 34% | 6/11/22 | 82,791 | 53% |
| 5/12/22 | 142,994 | 35% | 6/12/22 | 62,083 | 52% |
| 5/13/22 | 137,101 | 33% | 6/13/22 | 126,689 | 31% |
| 5/14/22 | 90,998 | 63% | 6/14/22 | 145,135 | 35% |
| 5/15/22 | 64,132 | 62% | 6/15/22 | 147,223 | 36% |
| 5/16/22 | 122,384 | 30% | 6/16/22 | 149,232 | 36% |
| 5/17/22 | 142,110 | 34% | 6/17/22 | 128,696 | 31% |
| 5/18/22 | 146,700 | 35% | 6/18/22 | 81,000 | 52% |
| 5/19/22 | 139,579 | 34% | 6/19/22 | 59,700 | 50% |
| 5/20/22 | 129,696 | 31% | 6/20/22 | 190,519 | 46% |
| 5/21/22 | 79,151 | 55% | 6/21/22 | 139,128 | 34% |
| 5/22/22 | 58,328 | 57% | 6/22/22 | 142,991 | 35% |
| 5/23/22 | 122,734 | 30% | 6/23/22 | 145,725 | 35% |
| 5/24/22 | 142,605 | 35% | 6/24/22 | 139,138 | 34% |
| 5/25/22 | 140,786 | 34% | 6/25/22 | 102,548 | 66% |
| 5/26/22 | 138,534 | 33% | 6/26/22 | 133,905 | 112% |
| 5/27/22 | 121,145 | 29% | 6/27/22 | 121,117 | 29% |
| 5/28/22 | 72,484 | 50% | 6/28/22 | 143,650 | 35% |
| 5/29/22 | 67,713 | 66% | 6/29/22 | 146,086 | 35% |
| 5/30/22 | 55,228 | 49% | 6/30/22 | 139,546 | 34% |
| 5/31/22 | 128,984 | 31% |
| March | April | ||||
|---|---|---|---|---|---|
| Date | Actual | % of baseline | Date | Actual | % of baseline |
| 3/1/22 | 116,591 | 28% | 4/1/22 | 124,859 | 30% |
| 3/2/22 | 119,645 | 29% | 4/2/22 | 74,123 | 48% |
| 3/3/22 | 119,821 | 29% | 4/3/22 | 51,272 | 54% |
| 3/4/22 | 114,738 | 28% | 4/4/22 | 114,591 | 28% |
| 3/5/22 | 69,404 | 47% | 4/5/22 | 132,792 | 32% |
| 3/6/22 | 47,778 | 51% | 4/6/22 | 134,086 | 33% |
| 3/7/22 | 105,922 | 26% | 4/7/22 | 136,128 | 33% |
| 3/8/22 | 124,425 | 30% | 4/8/22 | 130,478 | 32% |
| 3/9/22 | 125,534 | 31% | 4/9/22 | 83,657 | 54% |
| 3/10/22 | 128,989 | 32% | 4/10/22 | 58,203 | 62% |
| 3/11/22 | 119,802 | 29% | 4/11/22 | 116,454 | 28% |
| 3/12/22 | 79,633 | 54% | 4/12/22 | 140,918 | 34% |
| 3/13/22 | 47,856 | 51% | 4/13/22 | 144,517 | 35% |
| 3/14/22 | 115,682 | 28% | 4/14/22 | 128,496 | 33% |
| 3/15/22 | 124,958 | 31% | 4/15/22 | 116,744 | 28% |
| 3/16/22 | 132,528 | 32% | 4/16/22 | 69,640 | 45% |
| 3/17/22 | 133,246 | 33% | 4/17/22 | 48,550 | 52% |
| 3/18/22 | 122,604 | 30% | 4/18/22 | 126,411 | 31% |
| 3/19/22 | 64,582 | 44% | 4/19/22 | 136,804 | 33% |
| 3/20/22 | 55,214 | 59% | 4/20/22 | 141,601 | 34% |
| 3/21/22 | 116,427 | 28% | 4/21/22 | 133,671 | 33% |
| 3/22/22 | 133,423 | 33% | 4/22/22 | 123,068 | 30% |
| 3/23/22 | 136,769 | 33% | 4/23/22 | 78,639 | 51% |
| 3/24/22 | 138,794 | 34% | 4/24/22 | 53,631 | 57% |
| 3/25/22 | 122,818 | 30% | 4/25/22 | 119,513 | 29% |
| 3/26/22 | 78,455 | 54% | 4/26/22 | 145,783 | 35% |
| 3/27/22 | 47,513 | 51% | 4/27/22 | 152,132 | 37% |
| 3/28/22 | 110,349 | 27% | 4/28/22 | 142,451 | 35% |
| 3/29/22 | 130,694 | 32% | 4/29/22 | 134,297 | 33% |
| 3/30/22 | 131,842 | 32% | 4/30/22 | 81,940 | 53% |
| 3/31/22 | 128.567 | 31% |
| Jan | Feb | ||||
|---|---|---|---|---|---|
| Date | Actual | % of baseline | Date | Actual | % of baseline |
| 1/1/22 | 33,207 | 27% | 2/1/22 | 93,595 | 23% |
| 1/2/22 | 33,868 | 40% | 2/2/22 | 98,733 | 24% |
| 1/3/22 | 76,203 | 19% | 2/3/22 | 102,320 | 25% |
| 1/4/22 | 81,318 | 21% | 2/4/22 | 101,395 | 25% |
| 1/5/22 | 83,880 | 21% | 2/5/22 | 62,221 | 41% |
| 1/6/22 | 83,267 | 21% | 2/6/22 | 39,915 | 45% |
| 1/7/22 | 77,533 | 20% | 2/7/22 | 93,679 | 23% |
| 1/8/22 | 50,145 | 32% | 2/8/22 | 101,597 | 25% |
| 1/9/22 | 34,980 | 42% | 2/9/22 | 103,028 | 25% |
| 1/10/22 | 78,304 | 20% | 2/10/22 | 107,862 | 26% |
| 1/11/22 | 82,622 | 21% | 2/11/22 | 103,982 | 25% |
| 1/12/22 | 83,468 | 21% | 2/12/22 | 67,329 | 44% |
| 1/13/22 | 84,293 | 21% | 2/13/22 | 40,021 | 45% |
| 1/14/22 | 84,594 | 21% | 2/14/22 | 99,132 | 24% |
| 1/15/22 | 52,771 | 34% | 2/15/22 | 107,895 | 26% |
| 1/16/22 | 34,796 | 41% | 2/16/22 | 114,063 | 28% |
| 1/17/22 | 50,331 | 41% | 2/17/22 | 114,227 | 28% |
| 1/18/22 | 86,555 | 22% | 2/18/22 | 112,118 | 27% |
| 1/19/22 | 86,271 | 22% | 2/19/22 | 84,282 | 55% |
| 1/20/22 | 89,335 | 23% | 2/20/22 | 48,258 | 54% |
| 1/21/22 | 90,526 | 23% | 2/21/22 | 61,555 | 37% |
| 1/22/22 | 55,150 | 35% | 2/22/22 | 108,429 | 26% |
| 1/23/22 | 36,790 | 44% | 2/23/22 | 111,642 | 27% |
| 1/24/22 | 84,803 | 21% | 2/24/22 | 114,606 | 28% |
| 1/25/22 | 91,443 | 23% | 2/25/22 | 109,786 | 27% |
| 1/26/22 | 92,297 | 23% | 2/26/22 | 65,164 | 43% |
| 1/27/22 | 94,977 | 24% | 2/27/22 | 51,667 | 57% |
| 1/28/22 | 92,192 | 23% | 2/28/22 | 103,912 | 25% |
| 1/29/22 | 57,761 | 37% | |||
| 1/30/22 | 37,357 | 44% | |||
| 1/31/22 | 85,391 | 22% |
| Nov | Dec | ||||
|---|---|---|---|---|---|
| Date | Actual | % of baseline | Date | Actual | % of baseline |
| 11/1/21 | 98,143 | 24% | 12/1/21 | 119,110 | 31% |
| 11/2/21 | 112,094 | 27% | 12/2/21 | 120,566 | 31% |
| 11/3/21 | 118,183 | 29% | 12/3/21 | 119,271 | 31% |
| 11/4/21 | 119,326 | 29% | 12/4/21 | 71,350 | 46% |
| 11/5/21 | 118,624 | 29% | 12/5/21 | 43,171 | 40% |
| 11/6/21 | 68,337 | 47% | 12/6/21 | 108,848 | 28% |
| 11/7/21 | 46,103 | 44% | 12/7/21 | 118,835 | 31% |
| 11/8/21 | 106,097 | 26% | 12/8/21 | 125,488 | 32% |
| 11/9/21 | 110,244 | 27% | 12/9/21 | 123,834 | 32% |
| 11/10/21 | 122,520 | 30% | 12/10/21 | 123,701 | 32% |
| 11/11/21 | 104,299 | 25% | 12/11/21 | 77,956 | 50% |
| 11/12/21 | 118,326 | 29% | 12/12/21 | 35,828 | 33% |
| 11/13/21 | 72,458 | 50% | 12/13/21 | 91,022 | 23% |
| 11/14/21 | 44,936 | 43% | 12/14/21 | 113,944 | 29% |
| 11/15/21 | 106,360 | 26% | 12/15/21 | 114,298 | 29% |
| 11/16/21 | 116,405 | 28% | 12/16/21 | 122,352 | 33% |
| 11/17/21 | 121,689 | 30% | 12/17/21 | 120,548 | 31% |
| 11/18/21 | 123,525 | 30% | 12/18/21 | 74,019 | 47% |
| 11/19/21 | 113,284 | 28% | 12/19/21 | 47,291 | 42% |
| 11/20/21 | 70,717 | 48% | 12/20/21 | 100,124 | 26% |
| 11/21/21 | 46,003 | 44% | 12/21/21 | 92,738 | 24% |
| 11/22/21 | 100,749 | 25% | 12/22/21 | 85,598 | 22% |
| 11/23/21 | 107,104 | 26% | 12/23/21 | 76,595 | 20% |
| 11/24/21 | 98,746 | 24% | 12/24/21 | 49,056 | 35% |
| 11/25/21 | 33,533 | 17% | 12/25/21 | 17,970 | 13% |
| 11/26/21 | 70,812 | 17% | 12/26/21 | 29,149 | 27% |
| 11/27/21 | 62,961 | 43% | 12/27/21 | 66,302 | 17% |
| 11/28/21 | 44,082 | 42% | 12/28/21 | 74,002 | 19% |
| 11/29/21 | 105,510 | 26% | 12/29/21 | 67,543 | 17% |
| 11/30/21 | 115,077 | 28% | 12/30/21 | 78,141 | 20% |
| 12/31/21 | 57,220 | 15% |
| Sept | Oct | ||||
|---|---|---|---|---|---|
| Date | Actual | % of baseline | Date | Actual | % of baseline |
| 9/1/21 | 101,187 | 24% | 10/1/21 | 118,283 | 28% |
| 9/2/21 | 103,936 | 25% | 10/2/21 | 78,926 | 49% |
| 9/3/21 | 102,948 | 24% | 10/3/21 | 47,036 | 42% |
| 9/4/21 | 66,199 | 43% | 10/4/21 | 98,603 | 23% |
| 9/5/21 | 51,163 | 47% | 10/5/21 | 104,611 | 25% |
| 9/6/21 | 43,949 | 41% | 10/6/21 | 107,324 | 25% |
| 9/7/21 | 101,253 | 24% | 10/7/21 | 109,904 | 26% |
| 9/8/21 | 103,878 | 25% | 10/8/21 | 120,241 | 28% |
| 9/9/21 | 107,691 | 25% | 10/9/21 | 88,632 | 55% |
| 9/10/21 | 105,685 | 25% | 10/10/21 | 56,424 | 50% |
| 9/11/21 | 63,486 | 41% | 10/11/21 | 85,924 | 24% |
| 9/12/21 | 45,528 | 42% | 10/12/21 | 105,724 | 25% |
| 9/13/21 | 95,475 | 22% | 10/13/21 | 107,336 | 25% |
| 9/14/21 | 104,007 | 25% | 10/14/21 | 117,785 | 28% |
| 9/15/21 | 108,334 | 26% | 10/15/21 | 111,524 | 26% |
| 9/16/21 | 109,258 | 26% | 10/16/21 | 70,046 | 43% |
| 9/17/21 | 112,193 | 26% | 10/17/21 | 42,326 | 38% |
| 9/18/21 | 80,439 | 53% | 10/18/21 | 103,991 | 25% |
| 9/19/21 | 54,458 | 50% | 10/19/21 | 107,691 | 25% |
| 9/20/21 | 101,367 | 24% | 10/20/21 | 108,744 | 26% |
| 9/21/21 | 105,265 | 25% | 10/21/21 | 109,214 | 26% |
| 9/22/21 | 106,921 | 25% | 10/22/21 | 107,073 | 25% |
| 9/23/21 | 110,683 | 26% | 10/23/21 | 64,821 | 40% |
| 9/24/21 | 113,788 | 27% | 10/24/21 | 27,030 | 24% |
| 9/25/21 | 71,680 | 47% | 10/25/21 | 94,454 | 22% |
| 9/26/21 | 49,135 | 45% | 10/26/21 | 108,829 | 26% |
| 9/27/21 | 99,027 | 23% | 10/27/21 | 113,517 | 27% |
| 9/28/21 | 107,612 | 25% | 10/28/21 | 120,430 | 28% |
| 9/29/21 | 110,385 | 26% | 10/29/21 | 120,336 | 28% |
| 9/30/21 | 115,045 | 27% | 10/30/21 | 69,763 | 43% |
| 10/31/21 | 47,567 | 43% |
| July | Aug | ||||
|---|---|---|---|---|---|
| Date | Actual | % of baseline | Date | Actual | % of baseline |
| 7/1/21 | 83,826 | 20% | 8/1/21 | 38,902 | 38% |
| 7/2/21 | 80,302 | 19% | 8/2/21 | 79,987 | 19% |
| 7/3/21 | 49,459 | 30% | 8/3/21 | 88,767 | 21% |
| 7/4/21 | 41,490 | 39% | 8/4/21 | 89,772 | 22% |
| 7/5/21 | 45,691 | 34% | 8/5/21 | 87,973 | 21% |
| 7/6/21 | 79,923 | 19% | 8/6/21 | 89,377 | 22% |
| 7/7/21 | 83,600 | 20% | 8/7/21 | 56,111 | 36% |
| 7/8/21 | 85,181 | 21% | 8/8/21 | 38,858 | 38% |
| 7/9/21 | 83,815 | 20% | 8/9/21 | 80,443 | 19% |
| 7/10/21 | 50,883 | 32% | 8/10/21 | 88,737 | 21% |
| 7/11/21 | 38,926 | 36% | 8/11/21 | 90,084 | 22% |
| 7/12/21 | 79,531 | 19% | 8/12/21 | 91,325 | 22% |
| 7/13/21 | 85,674 | 21% | 8/13/21 | 92,799 | 22% |
| 7/14/21 | 86,900 | 21% | 8/14/21 | 58,226 | 37% |
| 7/15/21 | 88,298 | 21% | 8/15/21 | 41,367 | 40% |
| 7/16/21 | 87,131 | 21% | 8/16/21 | 86,479 | 21% |
| 7/17/21 | 52,579 | 33% | 8/17/21 | 93,042 | 23% |
| 7/18/21 | 39,411 | 37% | 8/18/21 | 96,503 | 23% |
| 7/19/21 | 83,915 | 20% | 8/19/21 | 96,374 | 23% |
| 7/20/21 | 88,917 | 21% | 8/20/21 | 102,530 | 25% |
| 7/21/21 | 87,704 | 21% | 8/21/21 | 65,553 | 42% |
| 7/22/21 | 88,516 | 21% | 8/22/21 | 47,892 | 42% |
| 7/23/21 | 85,841 | 21% | 8/23/21 | 90,850 | 22% |
| 7/24/21 | 51,048 | 32% | 8/24/21 | 96,647 | 23% |
| 7/25/21 | 40,545 | 38% | 8/25/21 | 96,644 | 23% |
| 7/26/21 | 78,829 | 19% | 8/26/21 | 100,163 | 24% |
| 7/27/21 | 87,840 | 21% | 8/27/21 | 105,564 | 25% |
| 7/28/21 | 88,477 | 21% | 8/28/21 | 63,291 | 40% |
| 7/29/21 | 92,101 | 22% | 8/29/21 | 44,050 | 43% |
| 7/30/21 | 84,797 | 21% | 8/30/21 | 91,123 | 22% |
| 7/31/21 | 50,577 | 32% | 8/31/21 | 97,658 | 24% |
| May | Jun | ||||
|---|---|---|---|---|---|
| Date | Actual | % below baseline | Date | Actual | % below baseline |
| 5/1/21 | 38,632 | 73% | 6/1/21 | 69,077 | 83% |
| 5/2/21 | 28,098 | 73% | 6/2/21 | 70,461 | 83% |
| 5/3/21 | 59,814 | 85% | 6/3/21 | 72,558 | 82% |
| 5/4/21 | 62,731 | 85% | 6/4/21 | 71,828 | 82% |
| 5/5/21 | 62,920 | 85% | 6/5/21 | 42,356 | 73% |
| 5/6/21 | 64,070 | 84% | 6/6/21 | 33,774 | 72% |
| 5/7/21 | 65,628 | 84% | 6/7/21 | 68,199 | 83% |
| 5/8/21 | 40,216 | 72% | 6/8/21 | 72,592 | 82% |
| 5/9/21 | 28,924 | 73% | 6/9/21 | 74,428 | 82% |
| 5/10/21 | 59,633 | 85% | 6/10/21 | 75,770 | 82% |
| 5/11/21 | 63,793 | 85% | 6/11/21 | 76,405 | 81% |
| 5/12/21 | 63,615 | 85% | 6/12/21 | 45,985 | 70% |
| 5/13/21 | 64,809 | 84% | 6/13/21 | 34,514 | 71% |
| 5/14/21 | 64,392 | 84% | 6/14/21 | 71,409 | 83% |
| 5/15/21 | 38,475 | 73% | 6/15/21 | 78,377 | 81% |
| 5/16/21 | 26,861 | 74% | 6/16/21 | 79,877 | 81% |
| 5/17/21 | 60,056 | 85% | 6/17/21 | 81,185 | 80% |
| 5/18/21 | 66,608 | 84% | 6/18/21 | 76,346 | 81% |
| 5/19/21 | 66,410 | 84% | 6/19/21 | 49,127 | 68% |
| 5/20/21 | 67,755 | 84% | 6/20/21 | 34,137 | 71% |
| 5/21/21 | 67,034 | 84% | 6/21/21 | 72,443 | 82% |
| 5/22/21 | 40,853 | 71% | 6/22/21 | 78,639 | 81% |
| 5/23/21 | 29,951 | 71% | 6/23/21 | 79, 609 | 81% |
| 5/24/21 | 63,762 | 85% | 6/24/21 | 81,946 | 80% |
| 5/25/21 | 66,893 | 84% | 6/25/21 | 83,487 | 80% |
| 5/26/21 | 68,355 | 83% | 6/26/21 | 52,635 | 66% |
| 5/27/21 | 70,861 | 80% | 6/27/21 | 42,901 | 64% |
| 5/28/21 | 69,537 | 83% | 6/28/21 | 73,817 | 82% |
| 5/29/21 | 41,247 | 71% | 6/29/21 | 80,980 | 80% |
| 5/30/21 | 34,437 | 67% | 6/30/21 | 82,102 | 80% |
| 5/31/21 | 33,706 | 70% |
| Mar | Apr | ||||
|---|---|---|---|---|---|
| Date | Actual | % below baseline | Date | Actual | % below baseline |
| 3/1/21 | 49,275 | 88% | 4/1/21 | 58,200 | 86% |
| 3/2/21 | 50,728 | 88% | 4/2/21 | 56,642 | 86% |
| 3/3/21 | 52,329 | 87% | 4/3/21 | 33,143 | 78% |
| 3/4/21 | 52,504 | 87% | 4/4/21 | 22,519 | 76% |
| 3/5/21 | 51,937 | 87% | 4/5/21 | 54,073 | 87% |
| 3/6/21 | 29,718 | 80% | 4/6/21 | 57,692 | 86% |
| 3/7/21 | 21,988 | 76% | 4/7/21 | 59,151 | 86% |
| 3/8/21 | 49,634 | 88% | 4/8/21 | 57,695 | 86% |
| 3/9/21 | 49,529 | 88% | 4/9/21 | 58,567 | 86% |
| 3/10/21 | 49,326 | 88% | 4/10/21 | 34,417 | 78% |
| 3/11/21 | 52,210 | 87% | 4/11/21 | 25,948 | 72% |
| 3/12/21 | 53,200 | 87% | 4/12/21 | 54,761 | 87% |
| 3/13/21 | 29,915 | 79% | 4/13/21 | 56,428 | 86% |
| 3/14/21 | 18,733 | 80% | 4/14/21 | 58,246 | 86% |
| 3/15/21 | 48,770 | 88% | 4/15/21 | 59,285 | 85% |
| 3/16/21 | 50,902 | 88% | 4/16/21 | 59,250 | 86% |
| 3/17/21 | 51,891 | 87% | 4/17/21 | 35,797 | 77% |
| 3/18/21 | 47,338 | 88% | 4/18/21 | 27,355 | 71% |
| 3/19/21 | 51,639 | 87% | 4/19/21 | 54,761 | 87% |
| 3/20/21 | 30,504 | 79% | 4/20/21 | 58,855 | 86% |
| 3/21/21 | 23,078 | 75% | 4/21/21 | 58,659 | 86% |
| 3/22/21 | 50,153 | 88% | 4/22/21 | 58,462 | 86% |
| 3/23/21 | 52,897 | 87% | 4/23/21 | 58,659 | 86% |
| 3/24/21 | 53,645 | 87% | 4/24/21 | 33,820 | 78% |
| 3/25/21 | 54,121 | 87% | 4/25/21 | 21,459 | 77% |
| 3/26/21 | 55,380 | 86% | 4/26/21 | 55,636 | 86% |
| 3/27/21 | 32,843 | 77% | 4/27/21 | 58,493 | 86% |
| 3/28/21 | 23,915 | 74% | 4/28/21 | 58,510 | 86% |
| 3/29/21 | 51,280 | 87% | 4/29/21 | 59,720 | 85% |
| 3/30/21 | 54,006 | 87% | 4/30/21 | 61,745 | 85% |
| 3/31/21 | 54,022 | 87% |
| Jan | Feb | ||||
|---|---|---|---|---|---|
| Date | Actual | % below baseline | Date | Actual | % below baseline |
| 1/1/21 | 14,108 | 89% | 2/1/21 | 44,487 | 89% |
| 1/2/21 | 18,034 | 88% | 2/2/21 | 45,016 | 89% |
| 1/3/21 | 15,151 | 82% | 2/3/21 | 47,600 | 88% |
| 1/4/21 | 38,874 | 90% | 2/4/21 | 47,611 | 88% |
| 1/5/21 | 44,162 | 89% | 2/5/21 | 47,637 | 88% |
| 1/6/21 | 42,398 | 89% | 2/6/21 | 27,333 | 82% |
| 1/7/21 | 43,594 | 89% | 2/7/21 | 18,239 | 80% |
| 1/8/21 | 42,351 | 89% | 2/8/21 | 45,558 | 89% |
| 1/9/21 | 22,221 | 86% | 2/9/21 | 47,482 | 88% |
| 1/10/21 | 15,654 | 81% | 2/10/21 | 49,243 | 88% |
| 1/11/21 | 42,559 | 89% | 2/11/21 | 45,930 | 89% |
| 1/12/21 | 44,203 | 89% | 2/12/21 | 46,404 | 89% |
| 1/13/21 | 44,666 | 89% | 2/13/21 | 25,567 | 83% |
| 1/14/21 | 44,525 | 89% | 2/14/21 | 19,242 | 79% |
| 1/15/21 | 44,032 | 89% | 2/15/21 | 23,604 | 86% |
| 1/16/21 | 23,063 | 85% | 2/16/21 | 47,835 | 88% |
| 1/17/21 | 17,388 | 79% | 2/17/21 | 48,623 | 88% |
| 1/18/21 | 25,337 | 79% | 2/18/21 | 48,643 | 88% |
| 1/19/21 | 42,807 | 89% | 2/19/21 | 46,633 | 89% |
| 1/20/21 | 42,102 | 89% | 2/20/21 | 27,244 | 82% |
| 1/21/21 | 45,650 | 88% | 2/21/21 | 19,724 | 78% |
| 1/22/21 | 42,175 | 89% | 2/22/21 | 47,556 | 88% |
| 1/23/21 | 24,051 | 85% | 2/23/21 | 49,139 | 88% |
| 1/24/21 | 13,746 | 84% | 2/24/21 | 49,784 | 88% |
| 1/25/21 | 43,148 | 89% | 2/25/21 | 50,074 | 88% |
| 1/26/21 | 42,633 | 89% | 2/26/21 | 50,383 | 88% |
| 1/27/21 | 41,187 | 90% | 2/27/21 | 28,909 | 81% |
| 1/28/21 | 41,122 | 90% | 2/28/21 | 21,129 | 76% |
| 1/29/21 | 45,039 | 87% | |||
| 1/30/21 | 23,533 | 85% | |||
| 1/31/21 | 17,577 | 79% |
| Nov | Dec | ||||
|---|---|---|---|---|---|
| Date | Actual | % below baseline | Date | Actual | % below baseline |
| 11/1/20 | 22,698 | 78% | 12/1/20 | 51,474 | 87% |
| 11/2/20 | 53,287 | 87% | 12/2/20 | 51,262 | 87% |
| 11/3/20 | 52,036 | 87% | 12/3/20 | 51,826 | 87% |
| 11/4/20 | 51,903 | 87% | 12/4/20 | 50,933 | 87% |
| 11/5/20 | 54,566 | 87% | 12/5/20 | 27,220 | 83% |
| 11/6/20 | 54,607 | 87% | 12/6/20 | 18,462 | 83% |
| 11/7/20 | 32,083 | 78% | 12/7/20 | 45,538 | 88% |
| 11/8/20 | 21,288 | 79% | 12/8/20 | 47,037 | 88% |
| 11/9/20 | 51,850 | 87% | 12/9/20 | 47,379 | 88% |
| 11/10/20 | 54,464 | 87% | 12/10/20 | 46,815 | 88% |
| 11/11/20 | 46,593 | 76% | 12/11/20 | 45,291 | 88% |
| 11/12/20 | 55,171 | 87% | 12/12/20 | 22,282 | 86% |
| 11/13/20 | 51,597 | 79% | 12/13/20 | 13,465 | 87% |
| 11/14/20 | 29,366 | 80% | 12/14/20 | 44,948 | 88% |
| 11/15/20 | 21,465 | 87% | 12/15/20 | 46,113 | 88% |
| 11/16/20 | 52,357 | 87% | 12/16/20 | 46,428 | 88% |
| 11/17/20 | 49,295 | 88% | 12/17/20 | 45,844 | 88% |
| 11/18/20 | 51,845 | 87% | 12/18/20 | 45,640 | 88% |
| 11/19/20 | 53,044 | 87% | 12/19/20 | 23,077 | 85% |
| 11/20/20 | 52,703 | 87% | 12/20/20 | 17,353 | 84% |
| 11/21/20 | 28,092 | 81% | 12/21/20 | 43,587 | 89% |
| 11/22/20 | 19,975 | 81% | 12/22/20 | 44,938 | 88% |
| 11/23/20 | 50,256 | 88% | 12/23/20 | 43,854 | 89% |
| 11/24/20 | 52,091 | 87% | 12/24/20 | 29,247 | 92% |
| 11/25/20 | 49,371 | 88% | 12/25/20 | 8,106 | 94% |
| 11/26/20 | 13,628 | 93% | 12/26/20 | 19,153 | 88% |
| 11/27/20 | 31,979 | 92% | 12/27/20 | 15,208 | 86% |
| 11/28/20 | 25,882 | 82% | 12/28/20 | 38,359 | 90% |
| 11/29/20 | 19,396 | 81% | 12/29/20 | 40,209 | 90% |
| 11/30/20 | 49,140 | 88% | 12/30/20 | 40,388 | 90% |
| 12/31/20 | 33,491 | 91% |
| Sept | Oct | ||||
|---|---|---|---|---|---|
| Date | Actual | % below baseline | Date | Actual | % below baseline |
| 9/1/20 | 47,764 | 89% | 10/1/20 | 52,349 | 88% |
| 9/2/20 | 48,344 | 89% | 10/2/20 | 51,497 | 88% |
| 9/3/20 | 49,007 | 88% | 10/3/20 | 28.261 | 82% |
| 9/4/20 | 47,772 | 89% | 10/4/20 | 21,309 | 81% |
| 9/5/20 | 25,622 | 83% | 10/5/20 | 50,086 | 88% |
| 9/6/20 | 18,596 | 83% | 10/6/20 | 52,126 | 88% |
| 9/7/20 | 19,731 | 82% | 10/7/20 | 52,639 | 88% |
| 9/8/20 | 47,785 | 89% | 10/8/20 | 52,685 | 88% |
| 9/9/20 | 45,437 | 89% | 10/9/20 | 52,860 | 88% |
| 9/10/20 | 46,832 | 89% | 10/10/20 | 29,692 | 82% |
| 9/11/20 | 45,506 | 89% | 10/11/20 | 21,871 | 80% |
| 9/12/20 | 22,631 | 85% | 10/12/20 | 45,029 | 87% |
| 9/13/20 | 9,933 | 91% | 10/13/20 | 52,731 | 88% |
| 9/14/20 | 45,657 | 89% | 10/14/20 | 53,138 | 87% |
| 9/15/20 | 48,427 | 89% | 10/15/20 | 54,067 | 87% |
| 9/16/20 | 49,818 | 88% | 10/16/20 | 53,412 | 87% |
| 9/17/20 | 50,119 | 88% | 10/17/20 | 30,736 | 81% |
| 9/18/20 | 49,921 | 88% | 10/18/20 | 21,609 | 80% |
| 9/19/20 | 26,477 | 83% | 10/19/20 | 51,624 | 88% |
| 9/20/20 | 19,202 | 82% | 10/20/20 | 53,785 | 87% |
| 9/21/20 | 47,864 | 89% | 10/21/20 | 54,514 | 87% |
| 9/22/20 | 50,240 | 88% | 10/22/20 | 54,513 | 87% |
| 9/23/20 | 51,343 | 88% | 10/23/20 | 55,187 | 87% |
| 9/24/20 | 51,174 | 88% | 10/24/20 | 30,724 | 81% |
| 9/25/20 | 51,085 | 88% | 10/25/20 | 22,122 | 80% |
| 9/26/20 | 28,242 | 82% | 10/26/20 | 50,927 | 88% |
| 9/27/20 | 20,579 | 81% | 10/27/20 | 54,337 | 87% |
| 9/28/20 | 47,674 | 89% | 10/28/20 | 54,806 | 87% |
| 9/29/20 | 51,032 | 88% | 10/29/20 | 55,360 | 87% |
| 9/30/20 | 51,754 | 88% | 10/30/20 | 55,705 | 87% |
| 10/31/20 | 30,152 | 81% |
| July | Aug. | ||||
|---|---|---|---|---|---|
| Date | Actual | % below baseline | Date | Actual | % below baseline |
| 7/1/20 | 47,183 | 89% | 8/1/20 | 24,892 | 84% |
| 7/2/20 | 46,450 | 89% | 8/2/20 | 17,192 | 83% |
| 7/3/20 | 32,725 | 92% | 8/3/20 | 45,111 | 89% |
| 7/4/20 | 18,568 | 86% | 8/4/20 | 45,897 | 89% |
| 7/5/20 | 17,169 | 84% | 8/5/20 | 46,389 | 89% |
| 7/6/20 | 43,928 | 89% | 8/6/20 | 46,782 | 89% |
| 7/7/20 | 47,220 | 89% | 8/7/20 | 46,015 | 89% |
| 7/8/20 | 47,231 | 89% | 8/8/20 | 23,595 | 85% |
| 7/9/20 | 46,946 | 89% | 8/9/20 | 17,962 | 83% |
| 7/10/20 | 45,972 | 89% | 8/10/20 | 46,149 | 89% |
| 7/11/20 | 23,874 | 85% | 8/11/20 | 46,425 | 89% |
| 7/12/20 | 17,777 | 84% | 8/12/20 | 46,863 | 89% |
| 7/13/20 | 45,336 | 89% | 8/13/20 | 46,740 | 89% |
| 7/14/20 | 46,264 | 89% | 8/14/20 | 45,321 | 89% |
| 7/15/20 | 46,456 | 89% | 8/15/20 | 23,380 | 85% |
| 7/16/20 | 46,021 | 89% | 8/16/20 | 16,006 | 84% |
| 7/17/20 | 45,652 | 89% | 8/17/20 | 43,891 | 89% |
| 7/18/20 | 22,612 | 86% | 8/18/20 | 46,699 | 89% |
| 7/19/20 | 17,258 | 84% | 8/19/20 | 46,316 | 89% |
| 7/20/20 | 42,089 | 90% | 8/20/20 | 46,162 | 89% |
| 7/21/20 | 45,290 | 89% | 8/21/20 | 45,449 | 89% |
| 7/22/20 | 45,712 | 89% | 8/22/20 | 22,486 | 86% |
| 7/23/20 | 45,847 | 89% | 8/23/20 | 16,462 | 84% |
| 7/24/20 | 44,300 | 89% | 8/24/20 | 44,347 | 89% |
| 7/25/20 | 22,791 | 86% | 8/25/20 | 46,321 | 89% |
| 7/26/20 | 17,185 | 84% | 8/26/20 | 46,899 | 89% |
| 7/27/20 | 43,318 | 89% | 8/27/20 | 47,282 | 89% |
| 7/28/20 | 45,085 | 89% | 8/28/20 | 46,394 | 89% |
| 7/29/20 | 45,918 | 89% | 8/29/20 | 24,322 | 84% |
| 7/30/20 | 45,899 | 89% | 8/30/20 | 18,234 | 82% |
| 7/31/20 | 45,818 | 89% | 8/31/20 | 45,329 | 89% |
| May | June | ||||
|---|---|---|---|---|---|
| Date | Actual | % below baseline | Date | Actual | % below baseline |
| 5/1/20 | 27,074 | 93% | 6/1/20 | 32,142 | 92% |
| 5/2/20 | 13,163 | 90% | 6/2/20 | 32,711 | 92% |
| 5/3/20 | 9,963 | 90% | 6/3/20 | 37,911 | 91% |
| 5/4/20 | 27,070 | 93% | 6/4/20 | 34,725 | 91% |
| 5/5/20 | 27,562 | 93% | 6/5/20 | 35,404 | 91% |
| 5/6/20 | 27,768 | 93% | 6/6/20 | 18,021 | 88% |
| 5/7/20 | 28,113 | 93% | 6/7/20 | 13,339 | 89% |
| 5/8/20 | 28,220 | 93% | 6/8/20 | 37,361 | 91% |
| 5/9/20 | 13,679 | 90% | 6/9/20 | 38,406 | 90% |
| 5/10/20 | 10,221 | 90% | 6/10/20 | 39,235 | 90% |
| 5/11/20 | 27,408 | 93% | 6/11/20 | 39,676 | 90% |
| 5/12/20 | 28,173 | 93% | 6/12/20 | 39,177 | 90% |
| 5/13/20 | 29,119 | 93% | 6/13/20 | 21,186 | 86% |
| 5/14/20 | 28,966 | 93% | 6/14/20 | 15,364 | 87% |
| 5/15/20 | 30,170 | 93% | 6/15/20 | 41,832 | 90% |
| 5/16/20 | 14,484 | 90% | 6/16/20 | 43,515 | 89% |
| 5/17/20 | 9,980 | 90% | 6/17/20 | 44,268 | 89% |
| 5/18/20 | 29,555 | 93% | 6/18/20 | 44,528 | 89% |
| 5/19/20 | 30,978 | 92% | 6/19/20 | 47,163 | 88% |
| 5/20/20 | 31,271 | 92% | 6/20/20 | 22,908 | 85% |
| 5/21/20 | 31,384 | 92% | 6/21/20 | 16,413 | 86% |
| 5/22/20 | 31,376 | 92% | 6/22/20 | 43,671 | 89% |
| 5/23/20 | 15,186 | 89% | 6/23/20 | 45,289 | 89% |
| 5/24/20 | 11,720 | 89% | 6/24/20 | 45,321 | 89% |
| 5/25/20 | 13,133 | 86% | 6/25/20 | 45,045 | 89% |
| 5/26/20 | 32,527 | 92% | 6/26/20 | 45,002 | 89% |
| 5/27/20 | 33,004 | 92% | 6/27/20 | 22,997 | 85% |
| 5/28/20 | 33,681 | 92% | 6/28/20 | 17,640 | 85% |
| 5/29/20 | 34,152 | 92% | 6/29/20 | 43,863 | 89% |
| 5/30/20 | 15,568 | 89% | 6/30/20 | 45,628 | 89% |
| 5/31/20 | 11,924 | 88% |
| March | April | ||||
|---|---|---|---|---|---|
| Date | Actual | % below baseline | Date | Actual | % below baseline |
| 3/2/20 | 379,775 | -5% | 4/1/20 | 29,896 | -93% |
| 3/3/20 | 388,262 | -7% | 4/2/20 | 28,649 | -93% |
| 3/4/20 | 384,382 | -7% | 4/3/20 | 28,965 | -93% |
| 3/5/20 | 375,215 | -10% | 4/4/20 | 11,430 | -93% |
| 3/6/20 | 328,949 | -12% | 4/5/20 | 7,835 | -92% |
| 3/7/20 | 113,388 | -24% | 4/6/20 | 24,909 | -94% |
| 3/8/20 | 74,791 | -21% | 4/7/20 | 26,378 | -93% |
| 3/9/20 | 301,547 | -24% | 4/8/20 | 25,507 | -94% |
| 3/10/20 | 292,192 | -30% | 4/9/20 | 24,688 | -94% |
| 3/11/20 | 268,192 | -35% | 4/10/20 | 24,401 | -94% |
| 3/12/20 | 231,820 | -45% | 4/11/20 | 11,292 | -93% |
| 3/13/20 | 186,605 | -50% | 4/12/20 | 7,582 | -92% |
| 3/14/20 | 58,187 | -61% | 4/13/20 | 24,271 | -94% |
| 3/15/20 | 37,006 | -61% | 4/14/20 | 23,890 | -94% |
| 3/16/20 | 118,572 | -70% | 4/15/20 | 24,498 | -94% |
| 3/17/20 | 54,031 | -87% | 4/16/20 | 23,779 | -94% |
| 3/18/20 | 48,085 | -88% | 4/17/20 | 24,006 | -94% |
| 3/19/20 | 45,915 | -89% | 4/18/20 | 11,249 | -93% |
| 3/20/20 | 42,461 | -89% | 4/19/20 | 8,205 | -91% |
| 3/21/20 | 18,793 | -87% | 4/20/20 | 22,997 | -94% |
| 3/22/20 | 12,737 | -87% | 4/21/20 | 23,277 | -94% |
| 3/23/20 | 34,933 | -91% | 4/22/20 | 24,205 | -94% |
| 3/24/20 | 32,117 | -92% | 4/23/20 | 24,093 | -94% |
| 3/25/20 | 32,625 | -92% | 4/24/20 | 24,530 | -94% |
| 3/26/20 | 31,601 | -92% | 4/25/20 | 11,895 | -92% |
| 3/27/20 | 31,142 | -92% | 4/26/20 | 8,763 | -91% |
| 3/28/20 | 12,389 | -92% | 4/27/20 | 24,209 | -94% |
| 3/39/20 | 9,453 | -90% | 4/28/20 | 25,007 | -94% |
| 3/30/20 | 29,584 | -93% | 4/29/20 | 25,302 | -94% |
| 3/31/20 | 28,877 | -93% | 4/30/20 | 25,687 | -94% |
Below is an archive of the daily updates BART provided on bart.gov during the pandemic.
Quick Links
Summary of Pandemic Response and Prevention Efforts
Mask Compliance Data (Sept 2020-December 2022)
2021 Daily Updates
2020 Daily Updates
Response and Prevention Efforts
The safety of BART riders and employees is our top priority. Since January 2020, BART has been actively monitoring and responding to the COVID-19 virus situation while communicating with local, state, and federal public health and emergency officials. BART follows the guidance and recommendations of local public health departments, California Department of Public Health, Centers for Disease Control and Prevention, and the World Health Organization, and frequently communicates safety information to employees and the public.
Since March 2, 2020, a cross-functional Pandemic Taskforce has been meeting twice a week to ensure our response plan is up to date, implement health and safety measures, and monitor COVID-19 developments to protect the health and safety of BART riders and employees and to ensure continuity of operations. Communication protocols have been clearly defined to ensure developments are being shared with all stakeholders including all BART employees.
On May 27, 2020 BART released a 15-step plan to welcome riders back. It outlines what riders can expect when riding our system.
BART also partnered with transit agencies from the nine Bay Area counties to launch "Riding Together, Bay Area Healthy Transit Plan," a comprehensive strategy with shared commitments to limit the spread of COVID-19. This website also includes a performance dashboard on topics such as mask compliance rates and capacity for safe distancing: http://www.healthytransitplan.com/
The District has taken the following preparedness actions:
Rider and Employee Safety
- During the height of the pandemic train cars were fogged with disinfectant every 24 hours. In April 2021, BART shifted cleaning resources towards traditional cleaning methods. CDC guidelines tell us the risk of surface transmission of COVID-19 is low and daily fogging is not necessary as COVID-19 is primarily transmitted through the air. Instead our cleaning resources are better spent using traditional methods to clean cars, stations, and bathrooms. BART continues to use hospital-grade disinfectant while cleaning and we are now hiring dozens of more cleaners to support traditional cleaning methods with a special focus on ensuring clean seats and clean restrooms.
- Touchpoints inside all stations and elevators are wiped down with disinfectant several times daily.
- Station Agents and Train Operators disinfect their booth or train cab interior twice per shift/run.
- Maintenance crews disinfect the inside of each maintenance vehicle daily.
- Hand sanitizer dispensers are installed at all stations.
- Masks are available to the public at all stations (see the station agent booth) and officers and ambassadors have extra masks for those who need one.
- The cleaning and disinfecting of employee work areas and breakrooms has been prioritized.
- Decontamination, notification, contact tracing, and testing protocol for employee potential COVID-19 exposure has been established.
- Signs announcing that everyone who enters BART must wear a mask and social distance are posted at all station entrances in multiple languages.
- Select secondary entrances at stations throughout the system have been temporarily closed to allow police and station personnel to focus their efforts on remaining entrances.
- BART Police Department has added fixed post deployment at stations. The FY21 budget added 10 new ambassador positions to increase non-sworn employee presence in the system and to help educate and promote wearing masks and spreading out.
- BART brought vaccines to employees and made it easy for employees to get vaccinated. A COVID-19 testing partner has been established for essential onsite BART workers with a hotline for prescreening and testing capability.
- BART partnered with UCSF and community partners to offer free COVID-19 testing for riders, employees and community members at the 24th Street Station Plaza in San Francisco. It is believed to be a first-in-the-nation pilot program to provide low-barrier COVID-19 testing — free, simple, and convenient — at a central transit hub. We also worked with community partners to provide free tests at Union City, West Oakland, Fruitvale, North Berkeley, and Colisuem.
- BART has offered our parking lots to public health officials, health care providers, and community groups for vaccination locations.
- Staff is upgrading air filters to MERV 14 (previously MERV 8 filters were being used) and UV lighting in HVAC duct work of train cars to kill viruses in the air flow. This work will be done by JUne 2021. The air you breathe while riding BART is filtered more effectively than that in the typical office or indoor setting like a grocery store or pharmacy, with an entire train car's air being replaced every 70 seconds.
- Elevators have significant air exchange by design compared to many indoor spaces and are required by code to have openings for ventilation. While riders are in an elevator for a very short duration- one minute or two, it is important to point out that fresh air is introduced every time the elevator door opens, and BART elevators include exhaust fans in the ceiling to increase ventilation.
Social Distancing Protocols
- Long trains are running system-wide to allow for social distancing and PA announcements are made on trains and in stations every 15 minutes reminding customers that they must wear a mask and social distance. Decals reminding riders to spread out are inside trains and stations.
- Mandated Social Distancing Protocol form and posters are posted at all BART facilities.
- Station Agents are directed to stay in their booth with the door closed, with one agent per booth and to provide service with minimal contact and social distancing. Station Agents are able to check Clipper cards through the glass and check tickets through the slot. If the Agent must leave the booth, they have been instructed to maintain social distancing.
- Breakrooms and outdoor break areas at maintenance facilities have fewer chairs to ensure 6-ft social distancing.
- Social distancing is discussed during daily Safety Briefings to ensure compliance while performing work.
- Additional maintenance vehicles have been added to transport crews to work site to support social distancing.
- Maintenance crew assignments are staggered to prevent gathering of personnel.
Health & Safety Communications
- Good hygiene signs in multiple languages are posted at all BART facilities.
- “Face coverings required” posters in multiple languages and pictograms are posted in all stations.
- Posters are displayed at all station agent booths letting riders know free masks are available at agent booths.
- Posters celebrating the rich cultural history of wearing masks are posted inside stations and onboard trains. These posters use art to remind people that masks have always served a useful function.
- Posters on board train cars remind riders that masks are required and cars are disinfected daily.
- Decals are posted in train car windows, inside stations, and elevators reminding riders to social distance.
- Audio announcements are made every 15 minutes reminding riders to spread out, wear a mask properly at all times, and to use our hand sanitizer stations.
- Large posters and banners greet riders as they enter outling new safety protocols.
- bart.gov is updated daily with ridership data. Crowding data is being posted weekly to show riders the expected crowding level per car.
- Air flow and air filter details have been shared on bart.gov and social media.
- Multiple communication channels are utilized to reach a wide audience including email blasts, BART app, SMS text, BART Watch app push notifications, train operator announcements, PA announcements, platform digital signs, and frequent news media updates.
- Weekly Safety Updates are sent to all employees on COVID-19 updates and safety guidance, and more often as specific guidance requires.
- HR guidance documents are shared with all employees with updates related to the Family First Coronavirus Response Act, Shelter in Place orders, remote work arrangements, COVID-19 testing protocols and the hotline for essential onsite employees, advice for managing fears around COVID-19, BART’s Employee Assistance Program, and more.
- Internal messaging is posted on monitors in shops, booths, and at key reporting locations.
- Weekly meetings are held with union leaders to discuss issues and collaborate on safety improvements.
Personal Protective Equipment
- All employees have been issued face coverings or face masks as appropriate (N95, Surgical, & Cloth).
- We are maintaining proper inventory of PPE.
- All employees have received a one-time payroll allowance for additional PPE purchases.
- All employees have disinfectant and hand sanitizer with daily visual inventory checks by supervisors.
- Staff has been issued enhanced PPE where available and necessary (i.e. face shields, respirator masks, gloves, goggles, Tyvek suits).
- Masks are available for riders at all stations.
Prevention tips include:
- Stay home when you are sick.
- Wear a face covering (required at BART)
- Wash your hands often with soap and water for at least 20 seconds. If soap and water are not available, use an alcohol-based hand sanitizer.
- Avoid touching your eyes, nose and mouth.
Mask Compliance Data
BART's mask mandate expired on 10/2/22. BART staff has been monitoring the percentage of riders wearing a mask. Counts are conducted four times a month, two morning shifts and two evening shifts covering 7:00AM – 8:30 PM. All lines are surveyed on each shift a total or 10 trains are boarded and surveyed. Two survey takers board the assigned train at one end and works their way car by car. One survey taker counts all the riders on the car, the other counts how many do not have a mask on their face or do not have the mask on correctly.
Wearing a mask is defined by a rider wearing a mask that covers their mouth and nose. When a mask is not covering both the mouth and nose it is counted as not wearing one.
BART began measuring face mask covering compliance in September 2020.
2022 Face Mask Rates by BART Riders
| % Masked | Total | 7:00AM-2:00PM | 2:00PM-8:30PM |
| Dec '22 | 62% | 64% | 56% |
| Nov '22 | 65% | 63% | 67% |
| Oct '22 | 74% | 79% | 66% |
| Sept '22 | 85% | 88% | 81% |
| Aug '22 | 85% | 83% | 88% |
| Jul '22 | 83% | 84% | 82% |
| Jun '22 | 89% | 92% | 82% |
| May '22 | 90% | 90% | 89% |
| Apr '22 | 93% | 93% | 94% |
| Mar '22 | 98% | 98% | 97% |
| Feb '22 | 98% | 98% | 98% |
| Jan '22 | 97% | 98% | 96% |
2020-2021 Face Mask Data
| Date | Shift | Compliance % |
| 9/11/20 | 3-7pm | 82% |
| 9/17/20 | 7-10am | 97% |
| 9/23/20 | 3-7pm | 87% |
| 9/29/20 | 7-10am | 96% |
| 10/1/20 | 7am-2pm | 93% |
| 10/5/20 | 3-7pm | 85% |
| 10/14/20 | 7am-2pm | 93% |
| 10/21/20 | 3-7pm | 90% |
| 10/27/20 | 7am-2pm | 94% |
| 11/6/20 | 2-8:30pm | 86% |
| 11/12/20 | 7am-2pm | 95% |
| 11/18/20 | 2-8:30pm | 88% |
| 12/1/20 | 7am-2pm | 96% |
| 12/7/20 | 2-4:30pm | 78% |
| 12/23/20 | 2-8:30pm | 90% |
| 12/29/20 | 7am-2pm | 96% |
| 1/8/21 | 7am-2pm | 94% |
| 1/13/31 | 2-8:30pm | 93% |
| 1/21/21 | 7am-2pm | 94% |
| 1/28/21 | 2-8:30pm | 91% |
| 2/1/21 | 7am-2pm | 97% |
| 2/12/21 | 2-8:30pm | 92% |
| 2/22/21 | 2-8:30pm | 92% |
| 2/25/21 | 7am-2pm | 96% |
| 3/1/21 | 7am-2pm | 93% |
| 3/12/21 | 2-8:30pm | 96% |
| 3/16/21 | 7am-2pm | 95% |
| 3/24/21 | 2-8:30pm | 95% |
| 4/7/21 | 7am-2pm | 96% |
| 4/22/21 | 7am-2pm | 97% |
| 4/29/21 | 2-8:30pm | 92% |
| 5/3/21 | 7am-2pm | 93% |
| 5/4/21 | 2-8:30pm | 87% |
| 5/12/21 | 2-8:30pm | 94% |
| 5/20/21 | 7am-2pm | 98% |
| 5/28/21 | 2-8:30pm | 93% |
| 6/1/21 | 7am-2pm | 96% |
| 6/14/21 | 2-8:30pm | 92% |
| 6/18/21 | 2-8:30pm | 91% |
| 6/24/21 | 7am-2pm | 95% |
| 7/1/21 | 7am-2pm | 96% |
| 7/15/21 | 2-8:30pm | 95% |
| 7/21/21 | 7am-2pm | 96% |
| 7/30/21 | 2-8:30pm | 94% |
| 8/3/21 | 7am-2pm | 97% |
| 8/16/21 | 7am-2pm | 95% |
| 8/26/21 | 2-8:30pm | 97% |
| 8/31/21 | 7am-2pm | 97% |
| 9/1/21 | 2-8:30pm | 96% |
| 9/17/21 | 7am-2pm | 94% |
| 9/23/21 | 2-8:30pm | 97% |
| 9/28/21 | 7am-2pm | 97% |
| 10/4/21 | 2-8:30pm | 88% |
| 10/13/21 | 7am-2pm | 99% |
| 10/21/21 | 2-8:30pm | 96% |
| 10/29/21 | 7am-2pm | 97% |
| 11/2/21 | 2-8:30pm | 96% |
| 11/12/21 | 7am-2pm | 98% |
| 11/18/21 | 2-8:30pm | 92% |
| 11/24/21 | 7am-2pm | 95% |
| 12/9/21 | 2-8:30pm | 96% |
| 12/15/21 | 7am-2pm | 99% |
| 12/20/21 | 2-8:30pm | 97% |
| 12/28/21 | 7am-2pm | 95% |
2021 Daily Updates
Updated at 7:25am, December 31, 2021
BART ridership for Thursday, Dec 30 was 78,141, 20% of budget projections for a pre-Covid December weekday.
Updated at 3pm, December 30
BART ridership for Wednesday, Dec 29 was 67,543, 17% of budget projections for a pre-Covid December weekday.
Updated at 8am, December 29
BART ridership for Tuesday, Dec 28 was 74,002, 19% of budget projections for a pre-Covid December weekday.
Updated at 7:30am, December 28
BART ridership for Monday, Dec 27 was 66,302, 17% of budget projections for a pre-Covid December weekday.
Updated at 10am, December 27
BART ridership for Sunday, Dec 26 was 29,149, 27% of budget projections for a pre-Covid December Sunday.
Updated at 5:30am, December 26
BART ridership for Saturday, Dec 25 was 17,970, 13% of budget projections for a pre-Covid December holiday.
Updated at 5:30am, December 25
BART ridership for Friday, Dec 24 was 49,056, 35% of budget projections for a pre-Covid December holiday.
Updated at 7:30am, December 24
BART ridership for Thursday, Dec 23 was 76,595, 20% of budget projections for a pre-Covid December weekday.
Updated at 8:30am, December 23
BART ridership for Wednesday, Dec 22 was 85,598, 22% of budget projections for a pre-Covid December weekday.
Updated at 8:45am, December 22
BART ridership for Tuesday, Dec 21 was 92,738, 24% of budget projections for a pre-Covid December weekday.
Updated at 10am, December 21
BART ridership for Monday, Dec 20 was 100,124, 26% of budget projections for a pre-Covid December weekday.
Updated at 9am, December 20
BART ridership for Sunday, Dec 19 was 47,291, 42% of budget projections for a pre-Covid December Sunday.
BART ridership for Saturday, Dec. 18 was 74,019, 47% of budget projections for a pre-Covid December Saturday.
BART ridership for Friday, December 10 was 120,548, 31% of budget projections for a pre-Covid December weekday.
Updated at 9am, December 17
BART ridership for Thursday, Dec 16 was 122,352, 33% of budget projections for a pre-Covid December weekday.
Updated at 8:45am, December 16
BART ridership for Wednesday, Dec 15 was 114,298, 29% of budget projections for a pre-Covid December weekday.
Updated at 10am, December 15
BART ridership for Tuesday, Dec 14 was 113,944, 29% of budget projections for a pre-Covid December weekday.
Updated at 10:45am, December 14
BART ridership for Monday, Dec 13 was 90,022, 23% of budget projections for a pre-Covid December weekday.
Updated at 3pm, December 13
BART ridership for Sunday, Dec 12 was 35,828, 33% of budget projections for a pre-Covid December Sunday.
Updated at 6:20am, December 12
BART ridership for Saturday, Dec. 11 was 77,956, 50% of budget projections for a pre-Covid December Saturday.
BART ridership for Friday, December 10 was 123, 701, 32% of budget projections for a pre-Covid December weekday.
Updated at 10am, Dec 10
BART ridership for Thursday, Dec 9 was 123,834, 32% of budget projections for a pre-Covid December weekday.
Updated at 9:15am, Dec 9
BART ridership for Wednesday, Dec 8 was 125,488, 32% of budget projections for a pre-Covid December weekday. It is the single highest ridership day since the beginning of the pandemic.
BART ridership for Tuesday, Dec 7 was 118,835, 31% of budget projections for a pre-Covid December weekday.
Updated at 11am, Dec 7
BART ridership for Monday, Dec 6 was 108,848, 28% of budget projections for a pre-Covid December weekday.
Updated at 10:30am, Dec 6
BART ridership for Sunday, Dec 5 was 43,171, 40% of budget projections for a pre-Covid December Sunday.
BART ridership for Saturday, Dec 4 was 71,350, 46% of budget projections for a pre-Covid December Saturday.
BART ridership for Friday, Dec 3 was 119,271, 31% of budget projections for a pre-Covid December weekday.
New face covering compliance results have been posted in the chart above covering the period from November 2, 2021-November 24, 2021. Compliance rates for this period range from 92%-98%.
Updated at 7:30am, Dec 3
BART ridership for Thursday, Dec 2 was 120,566, 31% of budget projections for a pre-Covid December weekday.
Updated at 7:00am, Dec 2
BART ridership for Wednesday, Dec 1 was 119,110, 31% of budget projections for a pre-Covid December weekday.
Updated at 8:20am, Dec 1
BART ridership for Tuesday, Nov 30 was 115,077, 28% of budget projections for a pre-Covid November weekday.
Updated at 7:30am, Nov 30
BART ridership for Monday, Nov 29 was 105,510, 26% of budget projections for a pre-Covid November weekday.
BART ridership for Sunday, Nov 28 was 44,082, 42% of budget projections for a pre-Covid November Sunday.
Updated at 7:30am, Nov 28
BART ridership for Saturday, Nov 27 was 62,961, 43% of budget projections for a pre-Covid November Saturday.
Updated at 8:00am, Nov 27
BART ridership for Friday, Nov 26 was 70,812, 17% of budget projections for a pre-Covid November weekday.
BART ridership for Thursday, Nov 25 was 33,533, 17% of budget projections for a pre-Covid November holiday.
BART ridership for Wednesday, Nov 24 was 98,746, 24% of budget projections for a pre-Covid November weekday.
Updated at 9:30am, Nov 24
BART ridership for Tuesday, Nov 23 was 107,104, 26% of budget projections for a pre-Covid November weekday.
Updated at 9:00am, Nov 23
BART ridership for Monday, Nov 22 was 100,749, 25% of budget projections for a pre-Covid November weekday.
Updated at 9:30am, Nov 22
BART ridership for Sunday, Nov 21 was 46,003, 44% of budget projections for a pre-Covid November Sunday.
BART ridership for Saturday, Nov 20 was 70,717, 48% of budget projections for a pre-Covid November Saturday.
BART ridership for Friday, Nov 19 was 113,284, 28% of budget projections for a pre-Covid November weekday.
Updated at 9:30am, Nov 19
BART ridership for Thursday, Nov 18 was 123,525, 30% of budget projections for a pre-Covid November weekday. It is the single highest ridership day since the beginning of the pandemic.
Updated at 9am, Nov 18
BART ridership for Wednesday, Nov 17 was 121,689, 30% of budget projections for a pre-Covid November weekday.
Updated at 9:15am, Nov 17
BART ridership for Tuesday, Nov 16 was 116,405, 28% of budget projections for a pre-Covid November weekday.
Updated at 9am, Nov 16
BART ridership for Monday, Nov 15 was 106,360, 26% of budget projections for a pre-Covid November weekday.
Updated at 10am, Nov 15
BART ridership for Sunday, Nov 14 was 44,936, 43% of budget projections for a pre-Covid November Sunday.
Updated at 11:10am, Nov 14
BART ridership for Saturday, Nov 13 was 72,458, 50% of budget projections for a pre-Covid November Saturday.
Updated at 6:15am, Nov 13
BART ridership for Friday, Nov 12 was 118,326, 29% of budget projections for a pre-Covid November weekday.
Updated at 11:45am, Nov 12
BART ridership for Thursday, Nov 11 (Veterans Day Holiday) was 104,299, 25% of budget projections for a pre-Covid November weekday.
Updated at 9:50am, Nov 11
BART ridership for Wednesday, Nov 10 was 122,520, 30% of budget projections for a pre-Covid November weekday. It is the single highest ridership day since the beginning of the pandemic.
Updated at 7:30am, Nov 10
BART ridership for Tuesday, Nov 9 was 110,244, 27% of budget projections for a pre-Covid November Tuesday.
BART ridership for Monday, Nov 8 was 106,097, 26% of budget projections for a pre-Covid November Monday.
Updated at 7:20am, Nov 8
BART ridership for Sunday, Nov 7 was 46,103, 44% of budget projections for a pre-Covid November Sunday.
BART ridership for Saturday, Nov 6 was 68,337, 47% of budget projections for a pre-Covid November Saturday.
BART ridership for Friday, Nov 5 was 118,624, 29% of budget projections for a pre-Covid November weekday.
Updated at 9:15am, Nov 5
BART ridership for Thursday, Nov 4 was 119,326, 29% of budget projections for a pre-Covid November weekday.
Updated at 9:30am, Nov 4
BART ridership for Wednesday, Nov 3 was 118,183, 29% of budget projections for a pre-Covid November weekday.
New face covering compliance results have been posted in the chart above covering the period from Oct. 4- Oct. 29, 2021. Compliance rates for this period range from 88%-99% with an average of 96%.
Updated at 9:15am, Nov 3
BART ridership for Tuesday, Nov 2 was 112,094, 27% of budget projections for a pre-Covid November weekday.
Updated at 9am, Nov 2
BART ridership for Monday, Nov 1 was 98,143, 24% of budget projections for a pre-Covid November weekday.
Updated at 9:30am, Nov 1
BART ridership for Sunday, October 31 was 47,567, 43% of budget projections for a pre-Covid October Sunday.
Updated at 6am, October 31
BART ridership for Saturday, October 30 was 69,763, 43% of budget projections for a pre-Covid October Saturday.
Updated at 8am, October 30
BART ridership for Friday, October 29 was 120,336, 28% of budget projections for a pre-Covid October weekday.
Updated at 11:25am, October 29
BART ridership for Thursday, October 28 was 120,430, 28% of budget projections for a pre-Covid October weekday. It was BART's highest single-day ridership total since March 2020 as of 10/29. The previous record since COVID was Friday October 8 at 120,241.
Updated at 8:45am, October 28
BART ridership for Wednesday, October 27 was 113,517, 27% of budget projections for a pre-Covid October weekday.
BART ridership for Tuesday, October 26 was 108,829, 26% of budget projections for a pre-Covid October weekday.
Updated at 9:30am, October 26
BART ridership for Monday, October 25 was 94,454, 22% of budget projections for a pre-Covid October weekday.
Updated at 9:20am, October 25
BART ridership for Sunday, October 24 was 27,030, 24% of budget projections for a pre-Covid October Sunday.
BART ridership for Saturday, October 23 was 64,821, 40% of budget projections for a pre-Covid October Saturday.
BART ridership for Friday, October 22 was 107,073, 25% of budget projections for a pre-Covid October weekday.
Updated at 9:30am, October 22
BART ridership for Thursday, October 21 was 109,214, 26% of budget projections for a pre-Covid October weekday.
Updated at 9:30am, October 21
BART ridership for Wednesday, October 20 was 108,744, 26% of budget projections for a pre-Covid October weekday.
Updated at 10:20am, October 20
BART ridership for Tuesday, October 19 was 107,691, 25% of budget projections for a pre-Covid October weekday.
Updated at 3:30pm, October 19
BART ridership for Monday, October 18 was 103,991, 25% of budget projections for a pre-Covid October weekday.
Upated at 9:30am, October 18
BART ridership for Sunday, October 17 was 42,326, 38% of budget projections for a pre-Covid October Sunday.
Updated at 10:00 am, October 17, 2021
BART ridership for Saturday, October 16 was 70,046, 43% of budget projections for a pre-Covid October Saturday.
Updated at 10:50 am, October 16, 2021
BART ridership for Friday, October 15 was 111,524, 26% of budget projections for a pre-Covid October weekday.
Updated at 9:15am, October 15, 2021
BART ridership for Thursday, October 14 was 117,785, 28% of budget projections for a pre-Covid October weekday.
BART ridership for Wednesday, October 13 was 107,336, 25% of budget projections for a pre-Covid October weekday.
Updated at 9:45am, October 13, 2021
BART ridership for Tuesday, October 12 was 105,724, 25% of budget projections for a pre-Covid October weekday.
Updated at 11:15am, October 12, 2021
BART ridership for Monday October 11 (Columbus Day/Indigenous Peoples' Day holiday) was 85,924, 24% of budget projections for a pre-Covid weekday holiday in October.
Updated at 5:20am, October 11, 2021
BART ridership for Sunday October 10 was 56,424, 50% of budget projections for a pre-Covid October Sunday. It was the highest Sunday ridership since the pandemic.
BART ridership for Saturday, October 9 was 88,632, 55% of budget projections for a pre-Covid October Saturday. It was the highest Saturday ridership since the pandemic.
Updated at 8:00am, October 9, 2021
BART ridership for Friday, October 8 was 120,241, 28% of budget projections for a pre-Covid October weekday. Friday was the first day of what is expected to be a busy weekend in the Bay Area, including Fleet Week and the SF Giant's Playoffs. Friday was BART's highest single-day ridership total since March 2020 as of 10/9/21.
Updated at 10:10 am, October 8, 2021
BART ridership for Thursday, October 7 was 109,904, 26% of budget projections for a pre-Covid October weekday.
Updated at 10:40am, October 7, 2021
BART ridership for Wednesday, October 6 was 107,324, 25% of budget projections for a pre-Covid October weekday.
BART ridership for Tuesday, October 5 was 104,611, 25% of budget projections for a pre-Covid October weekday.
Updated at 9:20am, October 5, 2021
BART ridership for Monday, October 4 was 98,603, 23% of budget projections for a pre-Covid October weekday.
New face covering compliance results have been posted in the chart above covering the period from Sept. 1- Sept. 28, 2021. Compliance rates for this period range from 94%-97%.
Updated at 10am, October 4, 2021
BART ridership for Sunday, October 3 was 47,036, 42% of pre-Covid budget projections for a October Sunday.
BART ridership for Saturday, October 2 was 78,926, 49% of pre-Covid budget projections for a October Saturday.
BART ridership for Friday, October 1 was 118,283, 28% of budget projections for a pre-Covid October weekday. This is BART's highest single-day ridership total since March 2020.
Updated at 10am, Oct 1
BART ridership for Thursday, Sept. 30 was 115,045, 27% of budget projections for a pre-Covid September weekday. This is BART's highest single-day ridership total since March 2020 and also the last day of the 50% discount.
Updated at 9:00am, Sept 30
BART ridership for Wednesday, Sept. 29 was 110,385, 26% of budget projections for a pre-Covid September weekday.
Updated at 9:45am, Sept. 29
BART ridership for Tuesday, Sept. 28 was 107,612, 25% of pre-COVID budget projections for a weekday in September.
Updated at 9am, Sept. 28
BART ridership for Monday, Sept. 27 was 99,027, 23% of pre-COVID budget projections for a weekday in September.
Updated at 11:30am, Sept. 27
BART ridership for Sunday, Sept. 26 was 49,135, 45% of pre-Covid budget projections for a September Sunday.
BART ridership for Saturday, Sept. 25 was 71,680, 47 % of pre-Covid budget projections for a September Saturday.
Updated at 8:00 am, Sept. 25
BART ridership for Friday, September 24 was 113,788, 27% of pre-Covid projections for a September weekday. This is BART's highest single-day ridership total since March 2020.
Updated at 8:10am, Sept. 24
BART ridership for Thursday, September 23 was 110,683, 26% of pre-Covid projections for a September weekday.
Updated at 8:25am, Sept 23
BART ridership for Wednesday, Sept. 22 was 106,921, 25% of pre-COVID budget projections for a weekday in September.
Updated at 9:20am, Sept 22
BART ridership for Tuesday, Sept. 21 was 105,265, 25% of pre-COVID budget projections for a weekday in September.
Updated at 9:20am, Sept 21
BART ridership for Monday, Sept. 20 was 101,367, 24% of pre-COVID budget projections for a weekday in September.
Updated at 9:15am, Sept. 20
BART ridership for Sunday, Sept. 19 was 54,458, 50% of pre-Covid budget projections for a September Sunday. It was the highest Sunday ridership since the pandemic.
BART ridership for Saturday, Sept. 18 was 80,439, 53% of pre-Covid budget projections for a September Saturday. It was the highest Saturday ridership since the pandemic.
BART ridership for Friday, Sept. 17 was 112,193, 26% of pre-Covid budget projections for a weekday in September. It was the highest ridership day since March 2020.
Read our press release: 50% off drives 50% of pre-pandemic ridership for the first time
Updated at 9:30am, Sept. 17
BART ridership for Thursday, Sept. 16 was 109,258 , 26% of pre-COVID budget projections for a weekday in September. It was the highest ridership day since March 2020.
Updated at 10:15am, Sept. 16
BART ridership for Wednesday, Sept. 15 was 108,334 , 26% of pre-COVID budget projections for a weekday in September. It was the highest ridership day since March 2020.
Updated at 7am, Sept. 15
BART ridership for Tuesday, Sept. 14 was 104,007, 25% of pre-COVID budget projections for a weekday in September.
Updated at 9am, Sept. 14
BART ridership for Monday, Sept. 13 was 95,475, 22% of pre-COVID budget projections for a weekday in September.
Updated at 9am, Sept. 13
BART ridership for Sunday, Sept. 12 was 45,528, 42% of pre-Covid budget projections for a September Sunday.
BART ridership for Saturday, Sept. 11 was 63,486, 41% of pre-Covid budget projections for a September Saturday.
BART ridership for Friday, Sept. 10 was 105,685, 25% of pre-Covid budget projections for a weekday in September.
Updated at 10:30am, Sept. 10
BART ridership for Thursday, Sept. 9 was 107,691, 25% of pre-COVID budget projections for a weekday in September. It was the highest ridership day since March 2020.
Updated at 1pm, Sept. 9
We've posted a new monthly ridership report showcasing 12 month period ridership trends. This latest report is through the end of August 2021 and be found at https://www.bart.gov/about/reports/ridership.
Highlights include:
- We saw a 10.5% increase in total ridership from July to August, with this month reaching 24% of August 2019 ridership. Overall, markets associated with non-peak period trips drove growth while those associated with peak period commuters lagged.
- Ridership recovery is one month ahead of budget projections, but resurgent COVID cases are slowing a return to on-site work.
- Following the service increase on August 2, we saw the greatest increases in ridership in the evening (from 17% to 22% of 2019 levels) and on Saturday (from 32% to 37% of 2019 levels).
- Station-level exit data suggests that attendance at Giants and A’s home games as well as the start of on-site classes at area colleges and universities were drivers of ridership growth.
New face covering compliance results have been posted in the chart above covering the period from August 16, 2021-August 31, 2021. Compliance rates for this period range from 95%-97%. For this reporting period, "poor compliance," meaning someone has a mask but their mouth or nose is partially or not covered, was 3%. We continue to make clear announcements to reinforce masks are required when riding BART.
Updated at 9:15am, Sept. 9
BART ridership for Wednesday, Sept. 8 was 103,878, 25% of pre-COVID budget projections for a weekday in September.
Updated at 9:30am, Sept. 8
BART ridership for Tuesday, Sept. 7 was 101,253, 24% of pre-COVID budget projections for a weekday in September.
Updated at 10am, Sept. 7
BART ridership for Monday, Sept. 6 (Labor Day Holiday) was 43,949, 41% of pre-Covid budget projections for a weekday holiday in September.
Updated at 6:00am, Sept. 6
BART ridership for Sunday, Sept. 5 was 51,163, 47% of pre-Covid budget projections for a September Sunday. As of 9/6, it was the highest Sunday ridership since the pandemic.
Updated at 10:00am, Sept. 5
BART ridership for Saturday, Sept. 4 was 66,199, 43% of pre-Covid budget projections for a September Saturday. As of 9/5, it was the highest Saturday ridership since the pandemic.
Updated at 8:00am, Sept. 4
BART ridership for Friday, Sept. 3 was 102,948, 24% of pre-Covid budget projections for a weekday in September.
Updated at 9:30am, Sept. 3
BART ridership for Thursday, Sept. 2 was 103,936, 25% of pre-Covid budget projections for a weekday in September.
Updated at 9:45am, Sept 2
BART ridership for Wednesday, Sept. 1 was 101,187, 24% of pre-Covid budget projections for a weekday in September. Sept. 1st was the first day of our 50% off fare promotion for the month of September. Prior to the COVID-19 pandemic, September and October were BART's highest ridership months. This is why the baselines for each month are higher than June and July. The baselines represent what ridership was expected to be for the month before COVID hit.
Updated at 9:30am, Sept. 1
BART ridership for Tuesday, August 31 was 97,658, 24% of pre-Covid budget projections for a weekday in August.
Updated at 9:25am, August 31
BART ridership for Monday, Aug. 30 was 91,123, 22% of pre-Covid budget projections for a weekday in August.
Updated at 9am, August 30
BART ridership for Sunday, Aug. 29 was 44,050, 43% of pre-Covid budget projections for a Sunday in August.
BART ridership for Saturday, Aug. 28 was 63,291, 40% of pre-Covid budget projections for a Saturday in August.
BART ridership for Friday was 105,564, 25% of pre-Covid budget projections for a weekday in August. It was the highest ridership day since March 2020.
Updated at 10am, August 27
BART ridership for Thursday, Aug. 26 was 100,163, representing 24% of pre-Covid budget projections for a weekday in August.
Updated at 8:15am, August 26
BART ridership for Wednesday, Aug. 25 was 96,664, representing 23% of pre-Covid budget projections for a weekday in August.
Updated at 7am, August 25
BART ridership for Tuesday, Aug. 24 was 96,647, representing 23% of pre-Covid budget projections for a weekday in August.
Updated at 9:20am, August 24
BART ridership for Monday, Aug. 23 was 90,850, representing 22% of pre-Covid budget projections for a weekday in August.
Updated at 9:15am, August 23
BART ridership for Sunday, Aug 22 was 47,892, representing 42% of pre-Covid budget projections for a Sunday in Aug. As of 8/23, it was the highest Sunday ridership since the pandemic.
BART ridership for Saturday, August 21 was 65,553 representing 42% of pre-Covid budget projections for an August Saturday. As of 8/23, it was the highest Saturday ridership since the pandemic.
Updated at 8:30am, August 21
BART ridership for Friday, Aug. 20 was 102,530, 25% of pre-Covid budget projections for a weekday in August. As of Aug. 21, it marks the highest ridership day since March 2020.
Updated at 9:45am, August 20
BART ridership for Thursday, Aug. 19 was 96,374, 23% of pre-Covid budget projections for a weekday in August.
Updated 1 pm, August 19
BART ridership for Wednesday, Aug. 18 was 96,503, 23% of pre-Covid budget projections for a weekday in August. As of Aug. 19, it marks the highest ridership day since March 2020.
Updated at 7am, August 18
BART ridership for Tuesday, Aug. 17 was 93,042, representing 23% of pre-Covid budget projections for a weekday in August. As of August 18, it marks the highest ridership day since March 2020.
Updated at 9am, August 17
BART ridership for Monday, Aug. 16 was 86,479, representing 21% of pre-Covid budget projections for a weekday in August.
Updated at 9:15am, August 16
BART ridership for Sunday, Aug 15 was 41,367, representing 40% of pre-Covid budget projections for a Sunday in Aug. As of 8/16, it was the highest Sunday ridership since the pandemic.
BART ridership for Saturday, August 14 was 58,226 representing 37% of pre-Covid budget projections for an August Saturday. As of 8/16, it was the highest Saturday ridership since the pandemic.
BART ridership for Friday, August 13 was 92,799 representing 22% of pre-Covid budget projections for an August weekday. As of August 16, it marks the highest ridership day since March 2020.
Updated at 9am, August 13
BART ridership for Thursday, Aug. 12 was 91,325, 22% of pre-Covid budget projections for a weekday in August.
BART ridership for Wednesday, Aug. 11 was 90,084, 22% of pre-Covid budget projections for a weekday in August.
Updated at 8:00 am, August 11
BART ridership for Tuesday, Aug. 10 was 88,737, 21% of pre-Covid budget projections for a weekday in August.
Updated at 9:13am, August 10
BART ridership for Monday, Aug. 9 was 80,443, representing 19% of pre-Covid budget projections for a weekday in August.
Updated at 9:20am, August 9
BART ridership for Sunday, Aug 8 was 38,858, representing 38% of pre-Covid budget projections for a Sunday in Aug.
Updated at 5:30 am, August 8
BART ridership for Saturday, August 7 was 56,111 representing 36% of pre-Covid budget projections for an August Saturday. As of 8/8, it was the highest Saturday ridership since the pandemic.
Updated at 4:00 pm, August 7
BART ridership for Friday, August 6 was 89,377 representing 22% of pre-Covid budget projections for an August weekday.
Updated at 9:15am, August 6
BART ridership for Thursday, Aug. 5 was 87,973, representing 21% of pre-Covid budget projections for a weekday in August.
New face covering compliance results have been posted in the chart above covering the period from July 15, 2021-August 3, 2021. Compliance rates for this period range from 94%-97%. For this reporting period, "poor compliance," meaning someone has a mask but their mouth or nose is partially or not covered, was 3%. We continue to make clear announcements to reinforce masks are required when riding BART.
Updated at 9am, August 5
BART ridership for Wednesday, Aug. 4 was 89,772, representing 22% of pre-Covid budget projections for a weekday in August.
Updated at 9am, August 4
BART ridership for Tuesday, Aug. 3 was 88,767, representing 21% of pre-Covid budget projections for a weekday in August.
Updated at 9am, August 3
BART ridership for Monday, Aug. 2 was 79,987, representing 19% of pre-Covid budget projections for a weekday in August.
Updated at 5:20am, August 2
BART ridership for Sunday, Aug 1 was 38,902, representing 38% of pre-Covid budget projections for a Sunday in Aug.
BART ridership for Saturday, July 31 was 50,577, representing 32% of pre-Covid budget projections for a Saturday in July.
BART ridership for Friday, July 30 was 84,797, representing 21% of pre-Covid budget projections for a weekday in July.
Updated at 11am, July 30
BART ridership for Thursday, July 29 was 92,101, representing 22% of pre-Covid budget projections for a weekday in July. As of July 30, it marks the highest ridership day since March 2020.
Updated at 10am, July 29
BART ridership for Wednesday, July 28 was 88,477, representing 21% of pre-Covid budget projections for a weekday in July.
Updated at 9:10am, July 28
BART ridership for Tuesday, July 27 was 87,840, representing 21% of pre-Covid budget projections for a weekday in July.
Updated at 9:45am July 27
BART ridership for Monday, July 26 was 78,829, representing 19% of pre-Covid budget projections for a weekday in July.
Updated at 11am July 26
View our passenger loading/crowding data showing the expected average number of people on board each car on specific trains for the week July 26-July 30 at www.bart.gov/crowding.
Following the schedule change on August 2, we will no longer publish the occupancy data forecast. BART and all Bay Area transit are no longer subject to state physical distancing requirements and capacity restrictions. The return to near-regular service with expanded hours and 15 minutes headways offers more options for riders to spread out. We started sharing the charts in June 2020 and we applied for a COVID-19 related federal grant to get this data into our online and app-based trip planning tools, but we didn't get the grant. We kept the charts low-tech and accessible using the tools immediately available. We still find value in sharing occupancy data forecasts, and we will continue to explore funding opportunities. Our BART Wireless Technology project and our new Fleet of the Future trains will enable real time occupancy capabilities in the coming years and staff is already brainstorming possibilities.
BART ridership for Sunday, July 25 was 40,545, representing 38% of pre-Covid budget projections for a Sunday in July.
BART ridership for Saturday, July 24 was 51,048, representing 32% of pre-Covid budget projections for a Saturday in July.
BART ridership for Friday, July 23 was 85,841, representing 21% of pre-Covid budget projections for a weekday in July.
Updated at 9:45am, July 23
BART ridership for Thursday, July 22 was 88,516 representing 21% of pre-Covid budget projections for a weekday in July.
Updated at 8:50am, July 22
BART ridership for Wednesday, July 21 was 87,704 representing 21% of pre-Covid budget projections for a weekday in July.
Updated at 9:45am, July 21
BART ridership for Tuesday, July 20 was 88,917 representing 21% of pre-Covid budget projections for a weekday in July. As of July 21, it marks the highest ridership day since March 2020.
Updated at 10:30am, July 20
BART ridership for Monday, July 19 was 83,915, representing 20% of pre-Covid budget projections for a weekday in July.
New mask compliance data is now available and have been added to the chart above. For the period covering June 10-July 9, an average of 94% of riders were complying with the mask mandate.
Updated at 10:00am July 19
View our passenger loading/crowding data showing the expected average number of people on board each car on specific trains for the week July 19-July 23 at www.bart.gov/crowding.
BART ridership for Sunday, July 18 was 39,411, representing 37% of pre-Covid budget projections for a Sunday in July.
Updated at 8:30 am July 19
BART ridership for Saturday, July 17 was 52,579, representing 33% of pre-Covid budget projections for a Saturday in July.
Updated at 10:40am July 17
BART ridership for Friday, July 16 was 87,131, representing 21% of pre-Covid budget projections for a weekday in July.
Updated at 8:00am July 16
BART ridership for Thursday, July 15 was 88,298, representing 21% of pre-Covid budget projections for a weekday in July. It was the highest ridership day since March 2020.
Updated at 7:00am July 15
BART ridership for Wednesday, July 14 was 86,900, representing 21% of pre-Covid budget projections for a weekday in July. It was the highest ridership day since March 2020.
BART will begin limited late-night service tonight with four trains leaving either Embarcadero or Civic Center at 11:30pm and serving 16th, Daly City, West Oakland, MacArthur, El Cerrito del Norte, Pleasant Hill and Bay Fair stations.
Updated at 8:00am July 14
BART ridership for Tuesday, July 13 was 85,674, representing 21% of pre-Covid budget projections for a weekday in July.
Updated at 10:30am July 13
BART ridership for Monday, July 12 was 79,531, representing 19% of pre-Covid budget projections for a weekday in July.
Updated at 11:30am July 12
View our passenger loading/crowding data showing the expected average number of people on board each car on specific trains for the week July 12-July 16 at www.bart.gov/crowding.
BART ridership for Sunday, July 11 was 38,260, representing 36% of pre-Covid budget projections for a Sunday in July.
Updated at 7:00am July 11
BART ridership for Saturday, July 10 was 50,883, representing 32% of pre-Covid budget projections for a Saturday in July.
Updated at 3:00pm July 10
BART ridership for Friday, July 9 was 83,815 , representing 20% of pre-Covid budget projections for a weekday in July.
Updated at 2:30pm July 9
BART ridership for Thursday, July 8 was 85,181, representing 21% of pre-Covid budget projections for a weekday in July.
Updated at 7:30am July 8
BART ridership for Wednesday July 7 was 83,600, representing 20% of pre-Covid budget projections for a weekday in July
Updated at 9:30am July 7
BART ridership for Tuesday July 6 was 79,923, representing 19% of pre-Covid budget projections for a weekday in July.
Updated at 9:15am July 6
BART ridership for Monday July 5 was 45,691, representing 34% of pre-Covid budget projections for a weekday holiday in July.
Updated at 10am July 5
View our passenger loading/crowding data showing the expected average number of people on board each car on specific trains for the week July 5-July 9 at www.bart.gov/crowding.
BART ridership for Sunday July 4th was 41,490, representing 39% of pre-Covid budget projections for a Sunday in July. It is the highest percentage of ridership on any day since the pandemic began.
Updated at 8am July 4
BART ridership for Saturday, July 3rd was 49,459, representing 30% of pre-COVID budget projections for a Saturday in July.
Updated at 7:27am July 3
BART ridership for Friday, July 2nd was 80,302, representing 19% of pre-COVID budget projections for a weekday in July.
Updated at 10am July 2
BART ridership for Thursday, July 1 was 83,826, representing 20% of pre-COVID-19 budget projections for a weekday in July. It was the highest ridership day since the start of the pandemic.
Updated at 11:30am July 1
BART ridership for Wednesday, June 30 was 82,102, representing 20% of pre-COVID-19 budget projections for a weekday in June.
Today we announced will return to near-pre pandemic service on August 2 instead of August 30 as originally planned. The August 2 change includes extending closing times to midnight Monday through Saturday.
In the meantime, BART will also add late-night limited trains leaving downtown San Francisco at 11:30pm serving nine stations on Thursdays, Fridays, and Saturdays from July 15-July 31, to give late night workers and people attending events and dining in San Francisco additional options until the August 2 schedule change. The interim limited service is a plan BART can accomplish as it readies staff for the much more robust schedule change beginning August 2. Read the full details.
Updated at 8:15am June 30
BART ridership for Tuesday, June 29 was 80,980, representing 20% of pre-COVID-19 budget projections for a weekday in June.
Updated at 11am June 29
BART ridership for Monday, June 28 was 73,817, representing 18% of pre-COVID-19 budget projections for a weekday in June.
Updated at 10am, June 28
View our passenger loading/crowding data showing the expected average number of people on board each car on specific trains for the week June 28-July 2nd at www.bart.gov/crowding.
BART ridership for Sunday, June 27 was 42,901, representing 36% of pre-COVID-19 budget projections for a Sunday in June. As of 6/28/21, it was the highest Sunday ridership since the start of the pandemic.
BART ridership for Saturday, June 26 was 52,635, representing 34% of pre-COVID-19 budget projections for a Saturday in June. As of 6/28/21, it was the highest Saturday ridership since the start of the pandemic.
Updated at 5:30pm, June 26
BART ridership for Friday, June 25th was 83,487, representing 20% of pre-COVID-19 budget projections for a weekday in June. It was the highest ridership day since the start of the pandemic.
Updated at 1:52pm, June 25
BART ridership for Thursday, June 24th was 81,946, representing 20% of pre-COVID-19 budget projections for a weekday in June. It was the highest ridership day since the start of the pandemic.
Updated at 6:30am, June 24
BART ridership for Wednesday, June 23rd was 79,609, representing 19% of pre-COVID-19 budget projections for a weekday in June.
Updated at 9:45am, June 23
BART ridership for Tuesday, June 22 was 78,639, representing 19% of pre-COVID-19 budget projections for a weekday in June.
Yesterday we announced BART will be providing special event late night service for:
San Francisco's 4th of July fireworks.
We also provide special service for A's night games.
Updated at 9am, June 22
BART ridership for Monday, June 21 was 72,443, representing 18% of pre-COVID-19 budget projections for a weekday in June.
Updated at 1:30pm, June 21
View our passenger loading/crowding data showing the expected average number of people on board each car on specific trains for the week June 21-25 at www.bart.gov/crowding.
BART ridership for Sunday, June 20 was 34,137, representing 29% of pre-COVID-19 budget projections for a Sunday in June.
BART ridership for Saturday, June 19 was 49,127, representing 32% of pre-COVID-19 budget projections for a Saturday in June. As of 6/21/21, it was the highest Saturday ridership since the start of the pandemic.
BART ridership for Friday, June 18 was 76,346, representing 19% of pre-COVID-19 budget projections for a weekday in June.
Updated at 9:30am, June 18
BART ridership for Thursday, June 17th was 81,185, representing 20% of pre-COVID-19 budget projections for a weekday in June. As of 6/18/21, it was the highest ridership day since the start of the pandemic.
Updated at 9:15am, June 17
BART ridership for Wednesday, June 16th was 79,877, representing 19% of pre-COVID-19 budget projections for a weekday in June. As of 6/17/21, it was the highest ridership day since the start of the pandemic.
Updated at 9am, June 16
BART ridership for Tuesday, June 15th (the day marking the official reopening of the state) was 78,377, representing 19% of pre-COVID-19 budget projections for a weekday in June. As of 6/16/21, it was the highest ridership day since the start of the pandemic.
Updated at 9:15am, June 15
BART ridership for Monday, June 14th was 71,409, representing 17% of pre-COVID-19 budget projections for a weekday in June.
Updated at 11:30am June 14
View our passenger loading/crowding data showing the expected average number of people on board each car on specific trains for the week June 14-18 at www.bart.gov/crowding.
BART ridership for Sunday, June 13 was 34,514, representing 29% of pre-COVID-19 budget projections for a Sunday in June. As of 6/14/21, it was the highest Sunday ridership since the start of the pandemic.
Updated at 9:15am, June 13
BART ridership for Saturday, June 12 was 45,985, representing 30% of pre-COVID-19 budget projections for a Saturday in June. As of 6/13/21, it was the highest Saturday ridership since the start of the pandemic.
Today was the first day of increased service for Saturdays and we opened all entrances that were temporarily closed due to the pandemic.
Updated at 8:40am, June 12
BART ridership for Friday, June 11th was 76,405, representing 19% of pre-COVID-19 budget projections for a weekday in June. As of 6/12/21, it was the highest ridership day since the start of the pandemic.
Updated at 9:25am June 11
BART ridership for Thursday, June 10 was 75,770, representing 18% of pre-COVID-19 budget projections for a weekday in June. As of 6/11/21, it was the highest ridership day since the start of the pandemic and the first time we broke 75K.
Tomorrow is the first day of increased Saturday service with 16 added trips.
Yesterday the BART board approved a rider focused budget prioritzing increased service, running later hours, and system re-investment.
Update at 9am June 10
BART ridership for Wednesday, June 9 was 74,428, representing 18% of pre-COVID-19 budget projections for a weekday in June. As of 6/10/21, it was the highest ridership day since the start of the pandemic.
Update at 10am June 9
BART ridership for Tuesday, June 8 was 72,592, representing 18% of pre-COVID-19 budget projections for a weekday in June. As of 6/9/21, it was the highest ridership day since the start of the pandemic.
Updated at 9am June 8
BART ridership for Monday, June 7 was 68,199, representing 17% of pre-COVID-19 budget projections for a weekday in June.
Updated at 12pm June 7
View our passenger loading/crowding data showing the expected average number of people on board each car on specific trains for the week June 7-11 at www.bart.gov/crowding.
BART ridership for Sunday, June 6 was 33,774, representing 28% of budget projections for a pre-COVID-19 June Sunday.
BART ridership for Saturday, June 5 was 42,356, representing 27% of budget projections for a pre-COVID-19 June Saturday. As of 6/7/21, Saturday 6/5 had the highest Saturday ridership since the pandemic.
Ridership for Friday, June 4 was 71,828, representing 18% of budget projections for a pre-COVID-19 June weekday.
Today is the first day of the 26 new trips being added to the weekday schedule. The Trip Planner is updated and we have posted PDF timetables of the new schedule here.
Updated at 9:45am June 4
BART ridership for Thursday, June 3 was 72,558, representing 18% of pre-COVID-19 budget projections for a weekday in June. As of 6/4/21, it was the highest ridership day since the start of the pandemic.
On Monday, BART will increase service levels to provide more frequent service during our busiest hours Monday-Saturday. More details. Hours of service remain that same until August 30th. View the PDF schedule timetables for each line.
Updated at 9:30am June 3
BART ridership for Wednesday, June 2 was 70,461, representing 17% of pre-COVID-19 budget projections for a weekday in June.
Updated at 9am June 2
BART ridership for Tuesday, June 1 was 69,077, representing 17% of pre-COVID-19 budget projections for a weekday in June.
Updated at 11am June 1
View our passenger loading/crowding data showing the expected average number of people on board each car on specific trains for the week June 1-4 at www.bart.gov/crowding.
BART ridership for Monday, May 31 (Memorial Day holiday) was 33,706, representing 30% of budget projections for a pre-COVID-19 Memorial Day.
BART ridership for Sunday, May 30 was 34,437, representing 33% of budget projections for a pre-COVID-19 May Sunday. As of 6/1, Sunday 5/30 had the highest Sunday ridership since the pandemic.
BART ridership for Saturday, May 29 was 41,247, representing 29% of budget projections for a pre-COVID-19 May Saturday. As of 6/1, Saturday 5/29 had the highest Saturday ridership since the pandemic.
Ridership for Friday, May 28 was 69,537, representing 17% of budget projections for a pre-COVID-19 May weekday.
Updated at 8:15am May 28
BART ridership for Thursday, May 27th was 70,861, representing 20% of budget projections for a pre-COVID-19 May weekday. As of 5/28/21, it was the highest ridership day since the start of the pandemic.
Updated at 8:45am May 27
BART ridership for Wednesday, May 26 was 68,355 representing a 83% drop compared to budget projections for a pre-COVID-19 May weekday. As of 5/27/21 it was the highest ridership day since the start of the pandemic.
Today we released details about our June 7, 2021 service increase.
Also, today, Alameda County will hold a free walk-up Johnson and Johnson vaccine clinic in our Colisuem Station parking lot from 3pm-6pm. The event will be held in our north parking lot off Snell Street. It is open to anyone 18+ and no appointments are needed.
Updated at 10:15am May 26
BART ridership for Tuesday, May 25 was 66,893 representing a 84% drop compared to budget projections for a pre-COVID-19 May weekday.
Updated at 9am May 25
BART ridership for Monday, May 24 was 63,762 representing a 85% drop compared to budget projections for a pre-COVID-19 May weekday.
Updated at 11:50am May 24
View our passenger loading/crowding data showing the expected average number of people on board each car on specific trains for the week May 24-28 at www.bart.gov/crowding.
BART ridership for Sunday, May 23 was 29,951, representing a 71% drop compared to budget projections for a pre-COVID-19 May Sunday. As of 5/24, Sunday 5/23 had the highest Sunday ridership since the pandemic.
BART ridership for Saturday, May 22 was 40,853, representing a 71% drop compared to budget projections for a pre-COVID-19 May Saturday. As of 5/24, Saturday 5/22 had the highest Saturday ridership since the pandemic.
BART ridership for Friday, May 21 was 67,034, representing an 84% drop compared to budget projections for a pre-COVID-19 May weekday.
Updated at 8:50am May 21
BART ridership for Thursday, May 20 was 67,755 representing a 84% drop compared to budget projections for a pre-COVID-19 May weekday. As of 5/21/21 it was the highest ridership day since the start of the pandemic.
Updated at 9:15am May 20
BART ridership for Wednesday, May 19 was 66,410 representing a 84% drop compared to budget projections for a pre-COVID-19 May weekday.
Updated at 11:15am May 19
BART ridership for Tuesday, May 18 was 66,608 representing a 84% drop compared to budget projections for a pre-COVID-19 May weekday. As of 5/19/21 it was the highest ridership day since the start of the pandemic.
Updated at 8:30am May 18
BART ridership for Monday, May 17 was 60,056 representing a 85% drop compared to budget projections for a pre-COVID-19 May weekday. This is the first Monday to reach 60K.
Updated at 12:00pm May 17
View our passenger loading/crowding data showing the expected average number of people on board each car on specific trains for the week May 17-21 at www.bart.gov/crowding.
BART ridership for Sunday, May 16 was 26,861 representing a 74% drop compared to budget projections for a pre-COVID-19 May Sunday.
Updated at 8:50am May 16
BART ridership for Saturday, May 16 was 38,475 representing a 73% drop compared to budget projections for a pre-COVID-19 May Saturday.
Updated at 10:50am May 15
BART ridership for Friday, May 15 was 64,392, representing an 84% drop compared to budget projections for a pre-COVID-19 May weekday.
Updated at 8:45am May 14
BART ridership for Thursday, May 13 was 64,809, representing a 84% drop compared to budget projections for a pre-COVID-19 May weekday.
Updated at 8:45am May 13
BART ridership for Wednesday, May 12 was 63,615, representing a 85% drop compared to budget projections for a pre-COVID-19 May weekday.
Two Coliseum vaccination tickets was used on Wednesday. The total since the program began is 2,791.
Updated at 9am May 12
BART ridership for Tuesday, May 11 was 63,793, representing a 85% drop compared to budget projections for a pre-COVID-19 May weekday.
One Coliseum vaccination tickets was used on Tuesday. The total since the program began is 2,789.
Updated at 8:30am May 11
BART ridership for Monday, May 10 was 59,633, representing a 85% drop compared to budget projections for a pre-COVID-19 May weekday.
One Coliseum vaccination tickets was used on Monday. The total since the program began is 2,788.
Riders are returning to BART. We plan to increase service in June and then return to near pre-pandemic service and hours in September.
Between June 1st and June 15th we will add 26 new weekday trips. This will expand 15-minute frequencies on the lines with the highest ridership: Yellow, Green and Red. Saturday service will also get 15 new trips. These will all be long trains to continue facilitate social distancing.
Starting August 30, 2021, BART will expand service hours and significantly increase service:
- Weekday service will be 5am-12am (currently 5am-9pm) with 15-min frequencies on all lines from 5am-8pm
- Saturday service will be 6am-12am (currently 8am-9pm) with 5 routes and added trains during peak hours for 15-min frequency
50% off in September
BART will offer a special promotion of 50% off all fares on Clipper for the entire month of September. The discount will apply to already discounted Clipper cards such as Youth, Senior, RTC, Clipper Start, and the Gator Pass.
Phased Station Entrance Re-opening
To improve access to our stations, we will start reopening entrances/exits that were closed during the height of the pandemic. On May 15 all entrances at Embarcadero and Montgomery and one center entrance at Powell will open in anticipation of Muni opening subway service for two-lines (N and KT). Balboa Park Station entrance will also open on May 15. We will open all remaining closed entrances on June 14.
Budget Priorities
Increasing train service, reprioritizing traditional cleaning methods, and boosting visible safety staff dedicated to riding trains are among the initiatives prioritized in BART’s Fiscal Year 2022 budget planning.
The BART Board of Directors will discuss plans to increase service at their Board meeting on May 13, 2021. View the presentation outlining the FY22 Budget Service Plan, Operating & Capital Sources & Uses.
Updated at 9:15am May 10
View our passenger loading/crowding data showing the expected average number of people on board each car on specific trains for the week May 10-14 at www.bart.gov/crowding.
BART had a record ridership week.
BART ridership for Sunday, May 9 was 28,224, representing a 73% drop compared to budget projections for a pre-COVID-19 May Sunday. This was the highest Sunday since the start of the pandemic.
BART ridership for Saturday, May 8 was 40,216, representing a 72% drop compared to budget projections for a pre-COVID-19 May Saturday. This was the highest Saturday since the start of the pandemic.
BART ridership for Friday, May 7 was 65,628, representing a 84% drop compared to budget projections for a pre-COVID-19 May weekday. As of 5/10/21 it was the highest ridership day since the start of the pandemic.
One Coliseum vaccination tickets was used on Friday. The total since the program began is 2,787.
New face covering compliance results have been posted in the chart above covering the period from April 10, 2021-May 9, 2021. Compliance rates for this period range from 97%-87%. A drop was noticed after the CDC updated their mask mandate on May 3, 2021. For this reporting period, "poor compliance," meaning someone has a mask but their mouth or nose is partially or not covered, was 4%. We continue to make clear announcements to reinforce masks are required on BART property including outside.
Updated at 9:15am May 7
BART ridership for Thursday, May 8 was 64,070, representing a 84% drop compared to budget projections for a pre-COVID-19 May weekday.
No Coliseum vaccination tickets were used on Wednesday. The total since the program began is 2,786.
Updated at 9:45am May 6
BART ridership for Wednesday, May 5 was 62,920, representing a 85% drop compared to budget projections for a pre-COVID-19 May weekday.
No Coliseum vaccination tickets were used on Wednesday. The total since the program began is 2,786.
Updated at 8:53am May 5
BART ridership for Tuesday, May 4 was 62,731, representing a 85% drop compared to budget projections for a pre-COVID-19 May weekday.
Two Coliseum vaccination tickets was used on Tuesday. The total since the program began is 2,786.
Updated at 8:45am May 4
BART ridership for Monday, May 3 was 59,814, representing a 85% drop compared to budget projections for a pre-COVID-19 May weekday.
One Coliseum vaccination tickets was used on Monday. The total since the program began is 2,784.
Updated at 10:30am May 3
View our passenger loading/crowding data showing the expected average number of people on board each car on specific trains for the week May 3-7 at www.bart.gov/crowding.
BART ridership for Sunday, May 2 was 28,098, representing a 73% drop compared to budget projections for a pre-COVID-19 May Sunday.
Five Coliseum vaccination tickets were used on Sunday. The total since the program began is 2,783.
BART ridership for Saturday, May 1 was 38,632, representing a 73% drop compared to budget projections for a pre-COVID-19 May Saturday.
Two Coliseum vaccination tickets were used on Saturday. The total since the program began is 2,778.
BART ridership for Friday, April 30 was 61,745, representing an 85% drop compared to budget projections for a pre-COVID-19 April weekday. It was the highest ridership day since the start of the pandemic.
One Coliseum vaccination ticket was used on Friday. The total since the program began is 2,776.
Updated at 8:35 am April 30
BART ridership for Thursday, April 29th was 59,720, representing an 85% drop compared to budget projections for a pre-COVID-19 April weekday.
One Coliseum vaccination tickets was used on Thursday. The total since the program began is 2,775.
Updated at 9:20am April 29
BART ridership for Wednesday, April 28th was 58,510, representing an 86% drop compared to budget projections for a pre-COVID-19 April weekday.
Two Coliseum vaccination tickets were used on Wednesday. The total since the program began is 2,774.
Updated at 5:40am April 28
BART ridership for Tuesday, April 27th was 58,493, representing an 86% drop compared to budget projections for a pre-COVID-19 April weekday.
Three Coliseum vaccination tickets were used on Tuesday. The total since the program began is 2,772.
Updated at 8:42am April 27
BART ridership for Monday, April 26 was 55,636, representing an 86% drop compared to budget projections for a pre-COVID-19 April weekday.
One Coliseum vaccination ticket was used on Monday. The total since the program began is 2,769.
Updated at 8:20 am April 26
View our passenger occupancy data showing the expected average number of people on board each car on specific trains for the week April 26-30 at www.bart.gov/crowding.
BART ridership for Sunday, April 25th was 21,459, representing a 77% drop compared to budget projections for a pre-COVID-19 April Sunday.
One Coliseum vaccination ticket was used on Sunday. The total since the program began is 2,768.
Updated at 7:50am April 25
BART ridership for Saturday, April 24 was 33,820, representing a 78% drop compared to budget projections for a pre-COVID-19 April Saturday.
Zero Coliseum vaccination tickets were used on Saturday. The total since the program began is 2,767.
Updated at 7:30am April 24
BART ridership for Friday, April 23 was 58,569, representing an 86% drop compared to budget projections for a pre-COVID-19 April weekday.
One Coliseum vaccination ticket was used on Friday. The total since the program began is 2,767.
Updated at 11:50am April 23
BART ridership for Thursday, April 22 was 58,462, representing a 86% drop compared to budget projections for a pre-COVID-19 April weekday.
One Coliseum vaccination promotion tickets were used on Thursday. Total since the program started: 2,766.
Updated at 8:45am April 22
BART ridership for Wednesday, April 21 was 58,659, representing a 86% drop compared to budget projections for a pre-COVID-19 April weekday.
Two Coliseum vaccination promotion tickets were used Wednesday. Total since the program started: 2,765.
Updated at 10am April 21
BART ridership for Tuesday, April 20 was 58,855, representing a 86% drop compared to budget projections for a pre-COVID-19 April weekday.
No Coliseum vaccination promotion tickets were used Tuesday. Total since the program started: 2,763.
Updated at 9am April 20
BART ridership for Monday, April 19 was 54,761, representing a 87% drop compared to budget projections for a pre-COVID-19 April weekday.
Two Coliseum vaccination promotion tickets were used Monday. Total since the program started: 2,763. CalOES has informed BART that the Pedestrian Village tent at the Oakland Coliseum Vaccination Site will temporarily shut down from April 19, 2021- May 2, 2021. Only drive up appointments will be available. The site plans to resume walk-up appointments on Monday, May 3, 2021. This shut down is for the preparation and transition of the site to Alameda County. No free tickets will be handed out during this time as there will be no walk-in appointments. However, some of the free tickets we handed out previously can still be used (some people just used their Clipper card for the return trip or indicated they wanted to pay for their trip to support transit). We will continue to share the data of how many tickets has been used each day.
The BART Board of Directors will meet on Thursday, April 22nd to discuss the recently released FY22 Preliminary Budget Memo which includes the recommendation to defer the previously planned FY22 fare increase and other initiatives to encourage ridership growth during the Bay Area’s reopening process. The draft FY 22 budget funds increasing train service, reprioritizing traditional cleaning methods, and boosting visible safety staff dedicated to riding trains.
Multiple service scenarios are discussed in the FY22 Preliminary Budget Memo including a proposal to extend BART hours to midnight six days a week starting in September 2021, to increase Saturday service, and reduce the wait time between trains on weekdays back to only 15 minutes from 5am-8pm with 30-minute frequency from 8pm to midnight.
Between now and September BART has the flexibility to add as many as 26 trains mainly during weekday commute hours and a few on Saturdays when ridership numbers show an increase in demand. This data-driven focus on actual rider counts allows BART to boost service in a way that is sustainable, directly improves the rider experience, and maximizes limited resources.
Updated at 11am April 19
View our passenger loading/crowding data showing the expected average number of people on board each car on specific trains for the week April 19-23 at www.bart.gov/crowding.
BART ridership for Sunday, April 18 was 27,355, representing a 71% drop compared to budget projections for a pre-COVID-19 April Sunday.
No Coliseum vaccination promotion ticket were used on Sunday. Total since the program started: 2,761
BART ridership for Saturday, April 17 was 35,797, representing a 77% drop compared to budget projections for a pre-COVID-19 April Saturday.
Six Coliseum vaccination promotion tickets were used Saturday. Total since the program started: 2,761
BART ridership for Friday, April 16 was 59,250, representing a 86% drop compared to budget projections for a pre-COVID-19 April weekday.
Three Coliseum vaccination promotion tickets were used Friday. Total since the program started: 2,755
Updated at 9:15am April 16
BART ridership for Thursday, April 15 was 59,285, representing a 85% drop compared to budget projections for a pre-COVID-19 April weekday. It was the highest ridership day since the start of the pandemic.
No Coliseum vaccination promotion tickets were used on Thursday. Total since the program started: 2,752
Updated at 10am April 15th
BART ridership for Wednesday, April 14 was 58,246, representing a 86% drop compared to budget projections for a pre-COVID-19 April weekday.
One Coliseum vaccination promotion ticket were used on Wednesday. Total since the program started: 2,752
BART ridership for Tuesday, April 13 was 56,428, representing a 86% drop compared to budget projections for a pre-COVID-19 April weekday.
Three Coliseum vaccination promotion tickets were used on Tuesday. Total since the program started: 2,751
Updated at 9:15am April 13th
BART ridership for Monday, April 12 was 54,761, representing a 87% drop compared to budget projections for a pre-COVID-19 April weekday.
Two Coliseum vaccination promotion tickets were used Monday. Total since the program started: 2,748
Updated at 10:31am April 12
View our passenger loading/crowding data showing the expected average number of people on board each car on specific trains for the week April 12-16 at www.bart.gov/crowding.
New face mask compliance data has been added to chart above. The average for our latest reporting period is 95% compliance. BART began measuring face mask covering compliance in September 2020. Counts are conducted four times a month, two morning shifts and two evening shifts covering 7:00AM – 8:30 PM. All lines are surveyed on each shift a total or 10 trains are boarded and surveyed. Two survey takers board the assigned train at one end and works their way car by car. One survey taker counts all the riders on the car, the other counts how many do not have a mask on their face or do not have the mask on correctly. Compliance is defined by a rider wearing a mask that covers their mouth and nose. When a mask is not covering both the mouth and nose it is counted as non-compliant.
BART ridership for Sunday, April 11 was 25,948, representing a 72% drop compared to budget projections for a pre-COVID-19 April Sunday.
One Coliseum vaccination promotion ticket were used on Sunday. Total since the program started: 2,746
BART ridership for Saturday, April 10 was 34,417, representing a 78% drop compared to budget projections for a pre-COVID-19 April Saturday.
Four Coliseum vaccination promotion tickets were used Saturday. Total since the program started: 2,745
BART ridership for Friday, April 9 was 58,567, representing a 86% drop compared to budget projections for a pre-COVID-19 April weekday.
Three Coliseum vaccination promotion tickets were used Friday. Total since the program started: 2,741
Updated at 5:00am April 9
BART ridership for Thursday, April 8 was 57,695, representing an 86% drop compared to budget projections for a pre-COVID-19 April weekday.
One Coliseum vaccination promotion ticket was used Thursday. The total used since the program began is 2,738.
Updated at 8:40am April 8
BART ridership for Wednesday, April 7 was 59,151, representing a 86% drop compared to budget projections for a pre-COVID-19 April weekday. It was the highest ridership day since the start of the pandemic.
3 Coliseum vaccination promotion tickets were used Wednesday. Total since the program started: 2,737
Updated at 8:40am April 7
BART ridership for Tuesday, April 6 was 57,692, representing a 86% drop compared to budget projections for a pre-COVID-19 April weekday.
3 Coliseum vaccination promotion tickets were used Tuesday. Total since the program started: 2,734
Updated at 9am April 6
BART ridership for Monday, April 5 was 54,073, representing a 87% drop compared to budget projections for a pre-COVID-19 April weekday.
3 Coliseum vaccination promotion tickets were used Monday. Total since the program started: 2,731
Updated at 1:24pm April 5
View our passenger loading/crowding data showing the expected average number of people on board each car on specific trains for the week April 5-9 at www.bart.gov/crowding.
BART ridership for Sunday, April 4 (Easter) was 22,519, representing a 76% drop compared to budget projections for a pre-COVID-19 April Sunday.
4 Coliseum vaccination promotion tickets were used Sunday. Total since the program started: 2,728
BART ridership for Saturday, April 3 was 33,143, representing a 78% drop compared to budget projections for a pre-COVID-19 April Saturday.
7 Coliseum vaccination promotion tickets were used Saturday. Total since the program started: 2,724
BART ridership for Friday, April 2 was 56,642, representing a 86% drop compared to budget projections for a pre-COVID-19 April weekday.
7 Coliseum vaccination promotion tickets were used Friday. Total since the program started: 2,717
Updated at 8:20 am April 2
BART ridership for Thursday, April 1st was 58,200, representing an 86% percent drop compared to budget projections for a pre-COVID 19 April weekday.
It was the highest ridership day since the start of the pandemic and coincided with the Oakland Athletics' home opener at the Coliseum.
29 Coliseum vaccination promotion tickets were used on Thursday. Total since the program started: 2,710
Updated at 8:40am April 1
BART ridership for Wednesday, March 31 was 54,022, representing an 87% drop compared to budget projections for a pre-COVID-19 March weekday.
21 Coliseum vaccination promotion tickets were used on Wednesday. Total since the program started: 2,689
Updated at 8:50am March 31
BART ridership for Tuesday, March 30 was 54,006, representing an 87% drop compared to budget projections for a pre-COVID-19 March weekday.
24 Coliseum vaccination promotion tickets were used on Tuesday. Total since the program started: 2,668
Updated at 8:45am March 30
BART ridership for Monday, March 29 was 51,280, representing an 87% drop compared to budget projections for a pre-COVID-19 March weekday.
43 Coliseum vaccination promotion tickets were used on Monday. Total since the program started: 2,644
BART staff got an update from crews who are working to retrofit all BART cars with upgraded MERV-14 air fliters. Prior to COVID-19, BART cars used MERV 8 filters. Crews are targeting to have all train cars retrofitted by June 2021. Read our story about air flow and air fliters.
Updated at 8:45am March 29
View our passenger loading/crowding data showing the expected average number of people on board each car on specific trains for the week March 29-April 2 at www.bart.gov/crowding.
BART ridership for Sunday, March 28 was 23,915, representing an 74% drop compared to budget projections for a pre-COVID-19 March Sunday.
10 Coliseum vaccination promotion tickets were used Sunday. Total since the program started: 2,601
BART ridership for Saturday, March 27 was 32,843, representing an 77% drop compared to budget projections for a pre-COVID-19 March Saturday.
5 Coliseum vaccination promotion tickets were used Saturday. Total since the program started: 2,591
BART ridership for Friday, March 26 was 55,380, representing an 86% drop compared to budget projections for a pre-COVID-19 March weekday.
60 Coliseum vaccination promotion tickets were used Friday. Total since the program started: 2,586
Updated at 5pm, March 26
BART ridership for Thursday, March 25 was 54,121 representing an 87% drop compared to budget projections for a pre-COVID-19 March weekday.
78 Coliseum vaccination promotion tickets were used on Thursday. Total since the program started: 2,526
Updated at 8:30am, March 25
Today, the BART Board of Directors will get an update on BART's COVID-19 response efforts.
Yesterday, the MTC approved the allocation of $802 million to Bay Area transit operators as part of a second round of federal Coronavirus Response and Relief Appropriations Act (CRRSAA) funding to help transit agencies battered from revenue losses due to the COVID-19 pandemic. Under the action taken Wednesday, MTC allocated $274,420,539 to BART.
BART ridership for Wednesday, March 24 was 53,645 representing an 87% drop compared to budget projections for a pre-COVID-19 March weekday.
75 Coliseum vaccination promotion tickets were used on Wednesday. Total since the program started: 2,448
Updated at 8:20am, March 24
BART ridership for Tuesday, March 23 was 52,897, representing an 87% drop compared to budget projections for a pre-COVID-19 March weekday.
109 Coliseum vaccination promotion tickets were used on Tuesday. Total since the program started: 2,373
Updated at 8:30am, March 23
BART ridership for Monday, March 22 was 50,153, representing an 88% drop compared to budget projections for a pre-COVID-19 March weekday.
96 Coliseum vaccination promotion tickets were used on Monday. Total since the program started: 2,264
Updated at 10:15am, March 22
View our passenger loading/crowding data showing the expected average number of people on board each car on specific trains for the week March 22-26 at www.bart.gov/crowding.
BART ridership for Sunday, March 21 was 23,078, representing an 75% drop compared to budget projections for a pre-COVID-19 March Sunday.
91 Coliseum vaccination promotion tickets were used Sunday. Total since the program started: 2,168
BART ridership for Saturday, March 20 was 30,504, representing an 79% drop compared to budget projections for a pre-COVID-19 March Saturday.
138 Coliseum vaccination promotion tickets were used Saturday. Total since the program started: 2,077
BART ridership for Friday, March 19 was 51,639, representing an 87% drop compared to budget projections for a pre-COVID-19 March weekday.
142 Coliseum vaccination promotion tickets were used Friday. Total since the program started: 1,939
Updated at 10am, March 19
BART ridership for Thursday, March 18 was 47,338, representing an 88% drop compared to budget projections for a pre-COVID-19 March weekday.
46 Coliseum vaccination promotion tickets were used on Thursday. Total since the program started: 1,797
Updated at 1:30pm, March 18
BART ridership for Wednesday, March 17 was 51,891, representing an 87% drop compared to budget projections for a pre-COVID-19 March weekday.
33 Coliseum vaccination promotion tickets were used on Wed. Total since the program started: 1,751
Updated at 9:45am, March 17
BART ridership for Tuesday, March 16 was 50,902, representing an 88% drop compared to budget projections for a pre-COVID-19 March weekday.
42 Coliseum vaccination promotion tickets were used on Tuesday. Total since the program started: 1,718
Updated at 11:10am, March 16
BART ridership for Monday, March 15 was 48,770, representing an 88% drop compared to budget projections for a pre-COVID-19 March weekday.
32 Coliseum vaccination promotion tickets were used on Monday. Total since the program started: 1,676
Updated at 9:20am, March 15th
View our passenger loading/crowding data showing the expected average number of people on board each car on specific trains for the week March 15-19 at www.bart.gov/crowding.
BART ridership for Sunday, March 14 was 18,733, representing an 80% drop compared to budget projections for a pre-COVID-19 March Sunday.
38 Coliseum vaccination promotion tickets were used Sunday. Total since the program started: 1,644
BART ridership for Saturday, March 13 was 29,915, representing an 79% drop compared to budget projections for a pre-COVID-19 March Saturday.
79 Coliseum vaccination promotion tickets were used Saturday. Total since the program started: 1,606
BART ridership for Friday, March 12 was 53,200, representing an 87% drop compared to budget projections for a pre-COVID-19 March weekday.
88 Coliseum vaccination promotion tickets were used Friday. Total since the program started: 1,527
Updated at 11:130am, March 12
BART ridership for Thursday, March 11 was 52,210, representing an 87% drop compared to budget projections for a pre-COVID-19 March weekday.
53 Coliseum vaccination promotion tickets were used on Thursday. Total since the program started: 1,439
BART is joining public transit systems across the Bay Area in applauding the state’s latest move to prioritize essential public transit workers in the next phase of the vaccine distribution plan. Transit workers will be eligible for the vaccine beginning March 15th. State guidelines note how transit workers are at high risk for occupational exposure and acknowledge maintaining continuity of operations is critical. We thank the Governor and everyone involved in prioritizing transit employees including the California Transit Association for their tireless advocacy in working to get transit workers reprioritized.
Updated at 11:45am, March 11
Bay Area transit agencies are teaming up to ensure that those individuals who are eligible for the COVID-19 vaccine can use transit to get to vaccination sites - and can easily learn where and how to do it.
In the latest initiative of the collective Healthy Transit Plan, the website healthytransitplan.com includes a list of vaccination sites accessible by public transportation and the current special promotions offered by the agencies serving the sites.
Updated at 8:45am, March 11
BART ridership for Wednesday, March 10 was 49,326, representing an 88% drop compared to budget projections for a pre-COVID-19 March weekday.
51 Coliseum vaccination promotion tickets were used on Wednesday. Total since the program started: 1,386
Updated at 11:20am, March 10
The House of Representatives today passed the $1.9 trillion Covid-19 relief American Rescue Plan Act which includes $30.5 billion in emergency funding for transit. This follows Senate approval last Saturday and will provide the Bay Area with approximately $1.7 billion in formula funding, a portion of which is expected to flow to every urbanized area in the region. We don’t yet know how much of that amount BART will get but we will work with the Metropolitan Transportation Commission (MTC) on the funding allocation. BART is grateful that Congress continues to prioritize transit. This new relief helps us balance our budget without layoffs and drastic service cuts. It means we can remain nimble and responsive to changing travel patterns.
Meanwhile, the Metropolitan Transportation Commission continues their work to allocate emergency funds made available through the Coronavirus Response and Relief Supplemental Appropriations Act (CRRSAA) of 2021 approved earlier this year by the Trump administration.
Distribution of $802 million in Phase 2 CRRSAA funding among the region’s 27 transit operators is based on revenue losses through the fiscal year and recognizes that many operators received significantly more funding through the CARES Act than their actual revenue losses. The MTC allocation will also prioritize the needs of the most transit dependent, with special attention to the pattern of ridership that has returned to different agencies to date and how relief funding affects agencies’ ability to respond to those demands.
The MTC’s Programming and Allocations Committee is recommending BART receive $274 million in Phase 2 CRRSAA funding. The full commission will take this up for approval on March 24th.
The first tranche of CRRSSA funding helped BART close the current year budget gap and will be used to help balance the FY21 budget.
BART ridership for Tuesday, March 9 was 49,529, representing an 88% drop compared to budget projections for a pre-COVID-19 March weekday.
39 Coliseum vaccination promotion tickets were used on Tuesday. Total since the program started: 1,374
BART ridership for Monday, March 8 was 49,634, representing an 88% drop compared to budget projections for a pre-COVID-19 March weekday.
36 Coliseum vaccination promotion tickets were used on Monday. Total since the program started: 1,335
Updated at 9:15am, March 8
View our passenger loading/crowding data showing the expected average number of people on board each car on specific trains for the week March 8-13 at www.bart.gov/crowding.
BART ridership for Sunday, March 7 was 21,988, representing an 76% drop compared to budget projections for a pre-COVID-19 March Sunday.
48 Coliseum vaccination promotion tickets were used yesterday. Total since the program started: 1299
Updated at 7:30am, March 7
BART ridership for Saturday, March 6 was 29,718, representing an 80% drop compared to budget projections for a pre-COVID-19 March Saturday.
52 Coliseum vaccination promotion tickets were used yesterday. Total since the program started: 1251
Updated at 5:45am, March 6
BART ridership for Friday, March 5 was 51,937, representing an 87% drop compared to budget projections for a pre-COVID-19 March weekday.
62 Coliseum vaccination promotion tickets were used yesterday. Total since the program started: 1199
Updated at 9:30am, March 5
BART ridership for Thursday, March 4 was 52,504, representing an 87% drop compared to budget projections for a pre-COVID-19 March weekday.
65 Coliseum vaccination promotion tickets were used yesterday. Total since the program started: 1137
Updated at 9:30am, March 4
BART ridership for Wednesday, March 3 was 52,329, representing an 87% drop compared to budget projections for a pre-COVID-19 March weekday.
70 Coliseum vaccination promotion tickets were used on Wednesday. Total since the program started: 1067
Updated at 8:45am, March 3
BART ridership for Tuesday, March 2 was 50,728, representing an 88% drop compared to budget projections for a pre-COVID-19 March weekday.
114 Coliseum vaccination promotion tickets were used on Tuesday. Total since the program started: 1002
Updated at 8:50am, March 2
BART ridership for Monday, March 1 was 49,257, representing an 88% drop compared to budget projections for a pre-COVID-19 March weekday.
110 Coliseum vaccination promotion tickets were used on Monday. Total since the program started: 888
Updated at 8:45am, March 1
View our passenger loading/crowding data showing the expected average number of people on board each car on specific trains for the week March 1-5 at www.bart.gov/crowding.
BART ridership for Sunday Feb. 28 was 21,129, representing an 76% drop compared to budget projections for a pre-COVID-19 February Sunday.
84 Coliseum vaccination promotion tickets were used on Sunday. Total since the program started: 778
BART ridership for Saturday, Feb. 27 was 28,909, representing an 81% drop compared to budget projections for a pre-COVID-19 February Saturday.
140 Coliseum vaccination promotion tickets were used on Saturday. Total since the program started: 694
BART ridership for Friday, Feb. 26 was 50,383, representing an 88% drop compared to budget projections for a pre-COVID-19 February weekday.
128 Coliseum vaccination promotion tickets were used on Friday. Total since the program started: 554
Updated at 8:30 am, Febraury 26
BART ridership for Thursday, Feb. 25 was 50,074, representing an 88% drop compared to budget projections for a pre-COVID-19 February weekday.
43 Coliseum vaccination promotion tickets were used on Thursday. Total since the program started: 426
Updated at 10 am, Febraury 25
BART ridership for Wed., Feb. 24 was 49,782, representing an 88% drop compared to budget projections for a pre-COVID-19 February weekday.
16 Coliseum vaccination promotion tickets were used on Wednesday. Total since the program started: 383
Updated at 9am, Febraury 24
BART ridership for Tuesday, Feb. 23 was 49,139, representing an 88% drop compared to budget projections for a pre-COVID-19 February weekday.
45 Coliseum vaccination promotion tickets were used on Tuesday. Total since the program started: 367
Updated at 9:30am, Febraury 23
BART ridership for Monday, Feb. 22 was 47,556, representing an 88% drop compared to budget projections for a pre-COVID-19 February weekday.
28 Coliseum vaccination promotion tickets were used on Monday. Total since the program started: 322
Updated at 9:15am, Febraury 22
View our passenger loading/crowding data showing the expected average number of people on board each car on specific trains for the week Feb. 22-26 at www.bart.gov/crowding.
BART ridership for Sunday Feb. 14th was 19,724, representing an 78% drop compared to budget projections for a pre-COVID-19 February Sunday.
45 Coliseum vaccination promotion tickets were used on Sunday. Total since the program started: 294
BART ridership for Saturday, Feb. 13 was 27,244, representing an 82% drop compared to budget projections for a pre-COVID-19 February Saturday.
77 Coliseum vaccination promotion tickets were used on Saturday. Total since the program started: 249
Updated at 7:45am, Febraury 20
BART ridership for Friday, Feb. 19 was 46,633, representing an 89% drop compared to budget projections for a pre-COVID-19 February weekday.
73 Coliseum vaccination promotion tickets were used on Friday. Total since the program started: 172
Updated at 10:46am, Febraury 19
BART ridership for Thursday, Feb. 18 was 48,643, representing an 88% drop compared to budget projections for a pre-COVID-19 February weekday.
45 Coliseum vaccination promotion tickets were used on Thursday. Total since the program started: 99
Updated at 9:30am, Febraury 18
BART ridership for Wednesday, Feb. 17 was 48,623, representing an 88% drop compared to budget projections for a pre-COVID-19 February weekday.
38 Coliseum vaccination promotion tickets were used on Wed. BART is offering a free $7 ticket for those who take BART to get vaccinated at the Coliseum. Total since the program has started: 54
Updated at 9:15am, February 17
BART ridership for Tuesday, Feb. 16 was 47,835, representing an 88% drop compared to budget projections for a pre-COVID-19 February weekday.
Yesterday was the first day of the Colisuem vaccination site. 16 vaccination promotion tickets were used. BART is offering a free $7 ticket for those who take BART to get vaccinated at the Coliseum.
Updated at 9am, February 16
BART ridership for Monday, Feb. 15, President's Day Holiday was 23,604, representing an 86% drop compared to budget projections for a pre-COVID-19 weekday holiday in February.
Today is the first day of the new large-scale vaccination site at the Oakland Coliseum. BART will have extra staff at the Coliseum BART station to provide anyone who has received a vaccine a free $7 BART ticket on-site after showing their vaccination card with a matching date. $7 is enough fare to get home to any station in the system, except SFO station. AC Transit will operate a fare-free shuttle every 15-minutes directly from Coliseum BART to the vaccination site. The shuttle will pick up in front of the BART station on San Leandro BLVD. This shuttle will operate 7-days a week between 8 am – 7:30 pm, and riders are reminded to watch for the head-sign: Vaccine Shuttle/BART-Coliseum. All vaccine shuttles will observe onboard rider social distancing requirements not to exceed 10 passengers per trip.
Updated at 8am, February 15
BART is running today, Presidents Day, a Saturday service. The system will operate 8am-9pm and trains will run 30 minutes apart. Note today: a free bus bridge will shuttle passengers from Richmond Station to El Cerrito del Norte Station as crews continue a 3-day-long track work.
View our passenger loading/crowding data showing the expected average number of people on board each car on specific trains for the week Feb. 15-19 at www.bart.gov/crowding.
Alameda County Department of Public Health will conduct free COVID-19 testing in a specially equipped bus at our Coliseum station parking lot today, Feb. 8th, from 8am-8pm.
Testing is available to anyone no matter of immigration status. More information is available at: https://covid-19.acgov.org/testing
Tomorrow, Tuesday Feb 16th is the first day of the new large-scale vaccination site at the Oakland Coliseum. BART will have extra staff at the Coliseum BART station during BART operating hours to provide anyone who has received a vaccine a free $7 BART ticket on-site after showing their vaccination card with a matching date. $7 is enough fare to get home to any station in the system, except SFO station. AC Transit will operate a fare-free shuttle every 15-minutes directly from Coliseum BART to the vaccination site. The shuttle will pick up in front of the BART station on San Leandro BLVD. This shuttle will operate 7-days a week between 8 am – 7:30 pm, and riders are reminded to watch for the head-sign: Vaccine Shuttle/BART-Coliseum. All vaccine shuttles will observe onboard rider social distancing requirements not to exceed 10 passengers per trip.
BART ridership for Sunday Feb. 14th was 19,242, representing an 79% drop compared to budget projections for a pre-COVID-19 February Sunday.
Updated at 7:30 am, February 14
BART ridership for Saturday, Feb. 13 was 25,567, representing an 83% drop compared to budget projections for a pre-COVID-19 February Saturday.
Updated at 2 pm, February 13
BART ridership for Friday, Feb. 12 was 46,404, representing an 89% drop compared to budget projections for a pre-COVID-19 February weekday.
Updated at 11am, February 12
BART ridership for Thursday, Feb. 11 was 45,930, representing an 89% drop compared to budget projections for a pre-COVID-19 February weekday.
Updated at 2pm, February 11
BART is offering a free BART ride home for those who get vaccinated at the Coliseum vaccination site. The vaccination site, which opens on Tuesday, February 16, 2021, will be in the parking lot of the Oakland Coliseum, which is accessible from the Coliseum BART station.
Starting Tuesday, BART will have extra staff at the Coliseum BART station during BART operating hours to provide anyone who has received a vaccine a free $7 BART ticket on-site after showing their vaccination card with a matching date. $7 is enough fare to get home to any station in the system, except SFO station. BART is also working to ensure those individuals who have mobility challenges will have assistance getting between the Coliseum BART Station and the vaccination site.
The vaccination site will be jointly operated by the Federal Emergency Management Agency (FEMA) and the State of California through the Governor’s Office of Emergency Services (Cal OES) and is part of the wider effort to create 100 vaccination sites nationwide in the President’s first 100 days.
BART’s limited promotion of a free ride home from Coliseum is only available for the Coliseum site until further notice. It is not being offered for other vaccination locations in the Bay Area. The free ticket is non-refundable and is only available on-site during BART’s operating hours and on the same day of the person’s appointment as verified by the date on the vaccination card. Riders should check train arrival and departures times to and from the Coliseum Station for the day of their appointment to plan their trip.
Registration for vaccine appointments will be available through the state’s MyTurn scheduling system.
Updated at 12:30pm, February 11
BART ridership for Wednesday, Feb. 10 was 49,243, representing an 88% drop compared to budget projections for a pre-COVID-19 February weekday.
Updated at 11:15am, February 10
BART ridership for Tuesday, Feb. 9 was 47,482, representing an 88% drop compared to budget projections for a pre-COVID-19 February weekday.
Updated at 9am, February 9
BART ridership for Monday, Feb. 8 was 45,558, representing an 89% drop compared to budget projections for a pre-COVID-19 February weekday.
Updated at 9:15am, February 8
View our passenger loading/crowding data showing the expected average number of people on board each car on specific trains for the week Feb. 8-13 at www.bart.gov/crowding.
Alameda County Department of Public Health will conduct free COVID-19 testing in a specially equipped bus at our Coliseum station parking lot today, Feb. 8th, from 8am-8pm.
Testing is available to anyone no matter of immigration status. More information is available at: https://covid-19.acgov.org/testing
BART ridership for Sunday, Feb. 7 was 18,239, representing an 80% drop compared to budget projections for a pre-COVID-19 February Sunday.
BART ridership for Saturday, Feb. 6 was 27,333, representing an 82% drop compared to budget projections for a pre-pandemic February Saturday.
BART ridership for Friday, Feb. 5 was 47,637, representing an 88% drop compared to budget projections for a pre-COVID-19 February weekday.
Updated at 9:00am February 5
BART ridership for Thursday, February 4 was 47,611, representing an 88% drop compared to budget projections for a pre-COVID-19 February weekday.
Updated at 9:50am, February 4
BART ridership for Wednesday, February 3 was 47,600, representing an 88% drop compared to budget projections for a pre-COVID-19 February weekday.
On February 3, 2021 BART General Manager Bob Powers, along with transit leaders from across the country sent a letter to congressional leaders requesting $39.3 billion in emergency aid for public transit agencies nationwide in the next coronavirus relief bill. "Given the unprecedented ridership declines, revenue losses and additional costs caused by the pandemic, a new independent economic analysis shows that $39.3 billion in additional investment is needed to maintain operations today and to get through the years ahead.....Without additional federal resources, our agencies could be forced to implement drastic cuts to service, make unthinkable layoffs and/or delay or cancel critical capital projects. Such draconian actions would decimate transit service and impact all those who rely on it. Our industry directly employs more than 400,000 workers and supports millions of private sector jobs across the country."
Updated at 9:20am, February 3
BART ridership for Tuesday, February 2 was 45,016, representing an 89% drop compared to budget projections for a pre-COVID-19 February weekday.
Updated at 9am, February 2
BART ridership for Monday, February 1 was 44,487, representing an 89% drop compared to budget projections for a pre-COVID-19 February weekday.
The Centers for Disease Control and Prevention (CDC) issued an Order on January 29, 2021, requiring the public to wear face masks while on transit. The Transportation Security Administration (TSA) issued a Security Directive (SD) January 31, 2021 that is effective February 1, 2021 at 11:59 p.m. The SD was issued to enforce the requirements of the CDC Order mandating masks as well as implement President Biden's Executive Order issued on January 21, 2021.
BART has had a face covering mandate since April 22, 2020 due to local county ordinances. This will continue.
BART now has new posters inside trains that show how to properly wear a mask. Overhead announcements are also made.
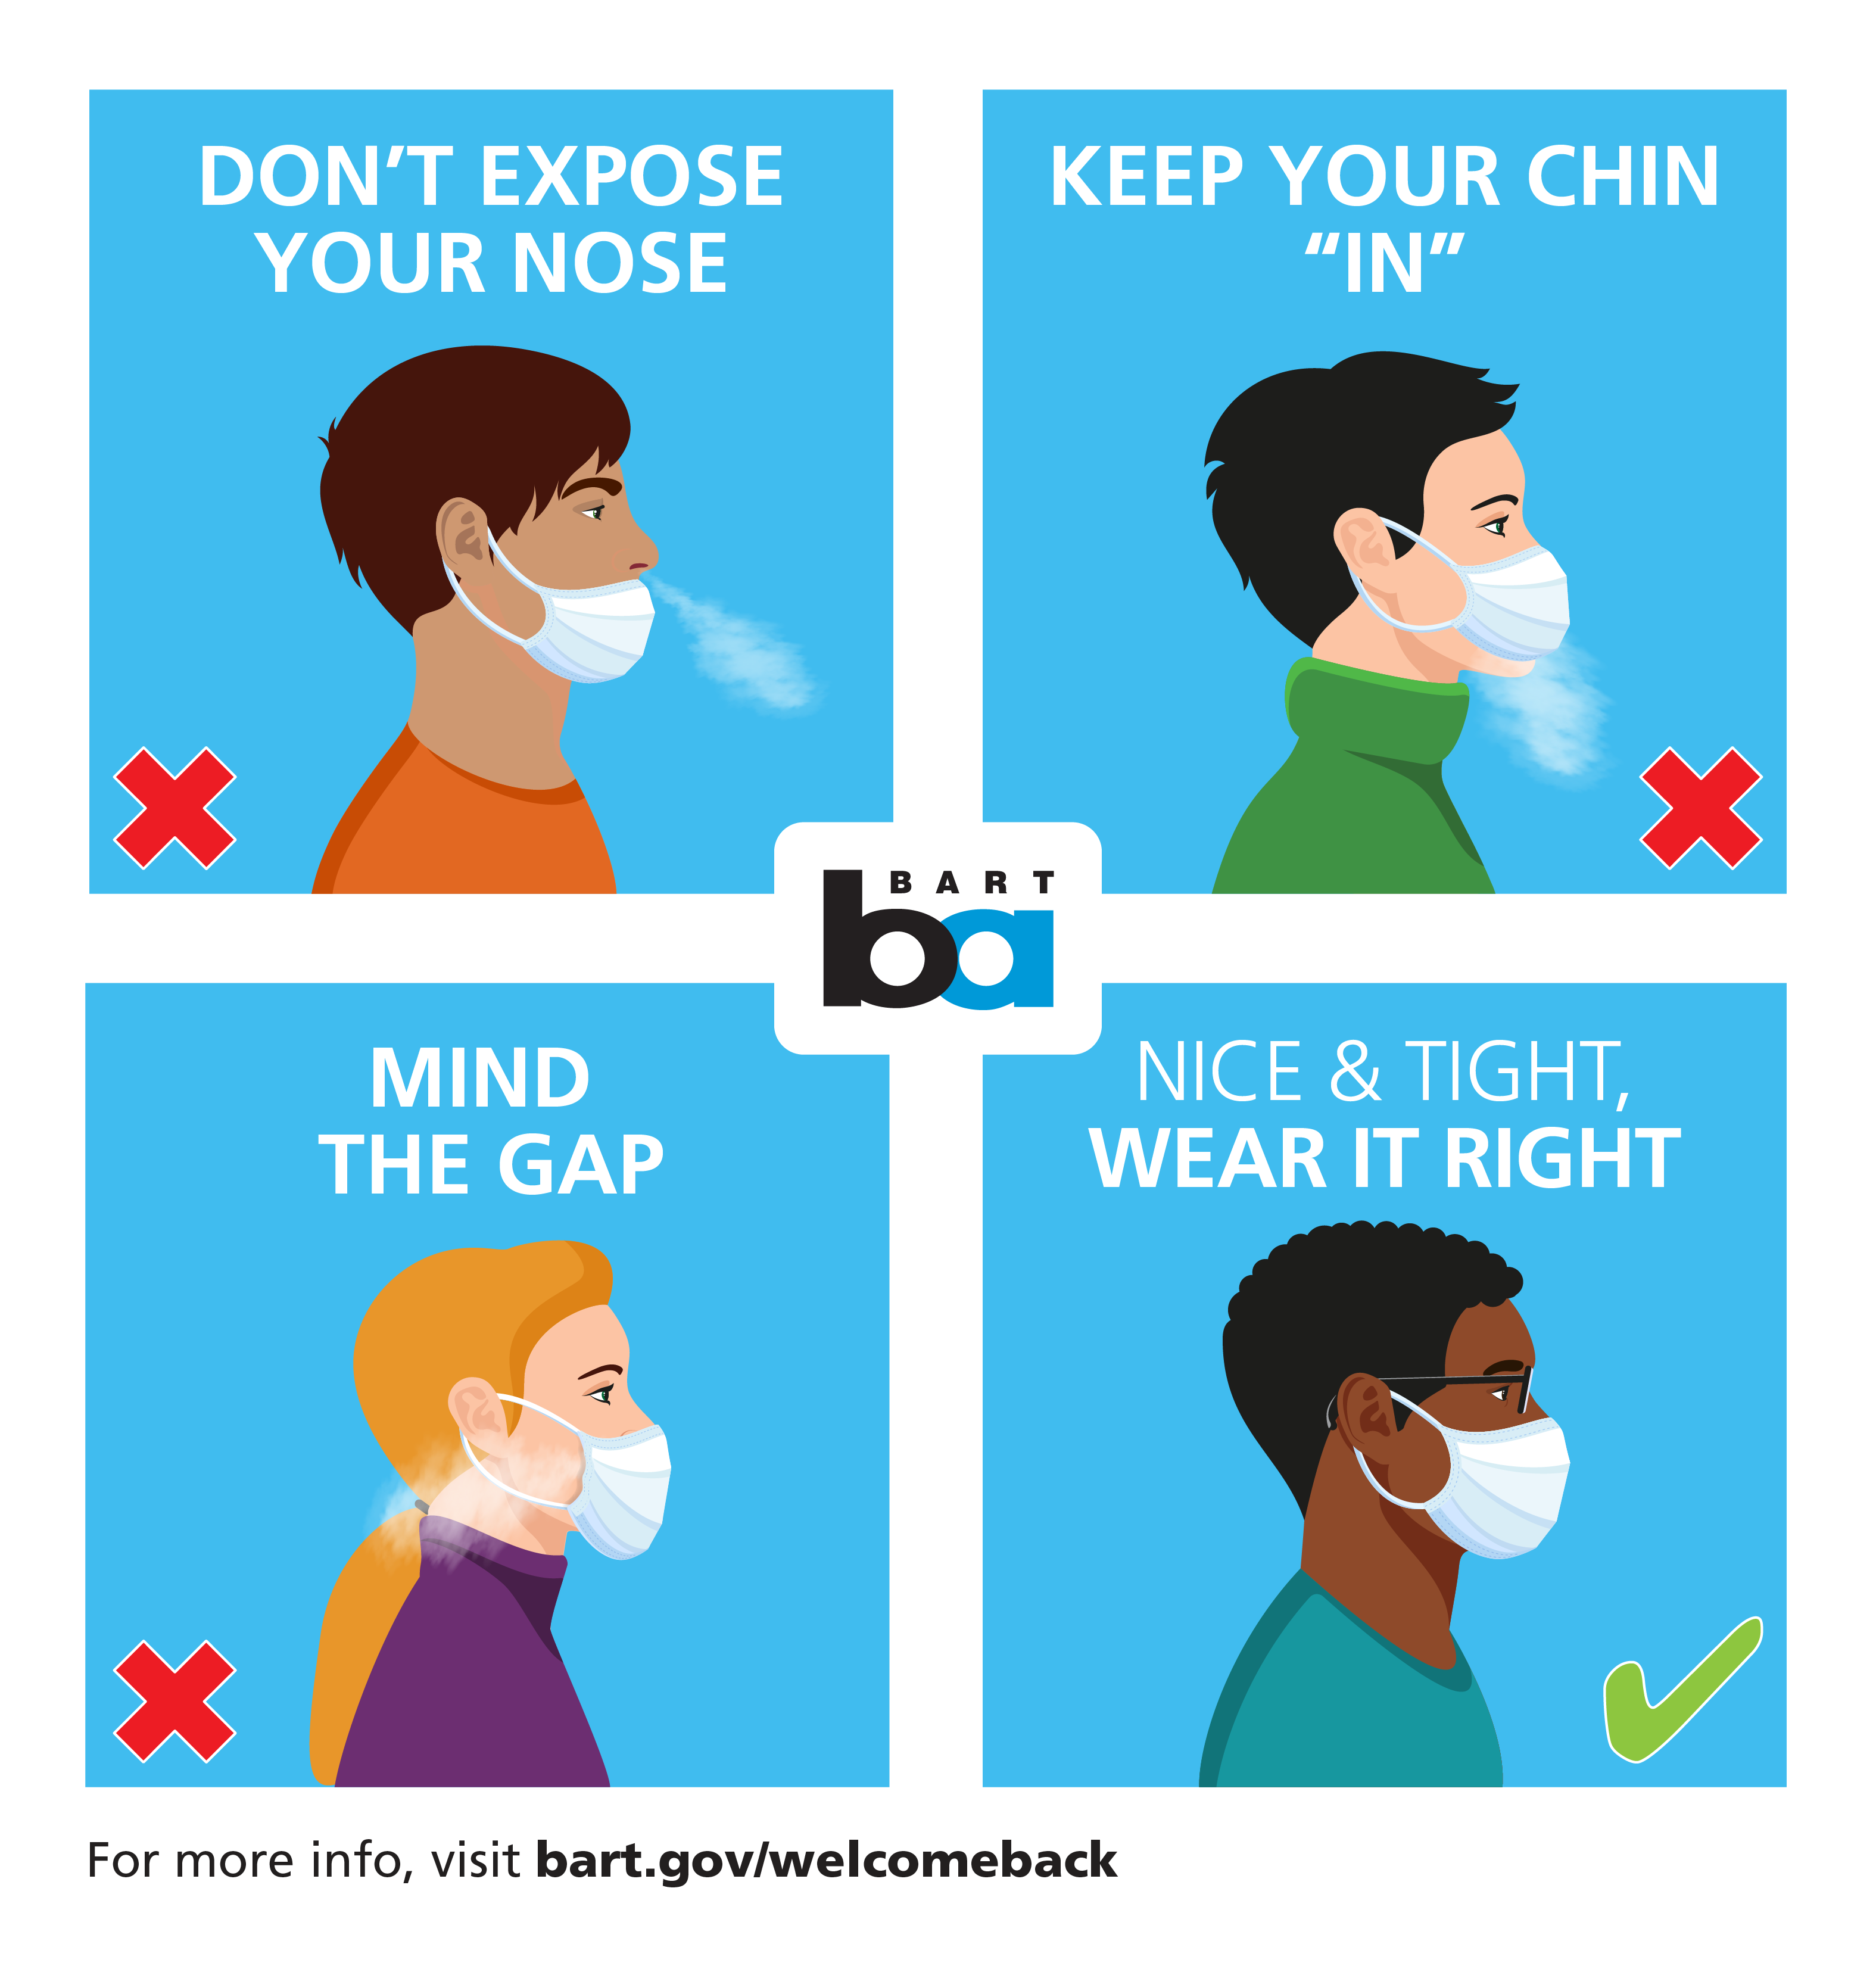
Updated at 9:30am, February 1
Alameda County Department of Public Health will conduct free COVID-19 testing in a specially equipped bus at two Oakland BART stations every Saturday & Monday through April. Alameda County’s focus is to locate these resources in neighborhoods that have been suffering from high rates of COVID-19 cases.
Every Saturday, from 8am-8pm, tests will be available at West Oakland Station
Every Monday, from 8am-8pm, tests will be available at Coliseum Station
There is free testing today, Monday, February 1, 2021 at the Coliseum BART Station and Saturday February 6 at the West Oakland BART Station.
Testing is available to anyone no matter of immigration status.
More information is available at: https://covid-19.acgov.org/testing
BART is offering our facilities to counties for testing and to help increase access for people who are transit dependent.
View our passenger loading/crowding data showing the expected average number of people on board each car on specific trains for the week Feb. 1-5 at www.bart.gov/crowding.
BART ridership for Sunday, January 31 was 17,577, representing an 79% drop compared to budget projections for a pre-COVID-19 January Sunday.
BART ridership for Saturday, January 30 was 23,533, representing an 85% drop compared to budget projections for a pre-pandemic January Saturday.
BART ridership for Friday, January 29 was 45,039, representing an 87% drop compared to budget projections for a pre-COVID-19 January weekday.
Updated at 1:15pm, January 29
BART ridership for Thursday January 28 was 41,122, representing an 90% drop compared to budget projections for a pre-COVID-19 January weekday.
This week, Bay Area transit agency leaders sent a letter to Governor Newsom advocating for the State to prioritize public transit workers within the new vaccine plan announced on Monday. The new plan moves away from a sector-based approach to prioritization and adopts a new age-based distribution for the COVID-19 vaccine. The plan effectively eliminates the prioritization of public transit workers within Phase 1B – Tier 2. The letter requests the state to preserve the current sector-based distribution that includes transit workers under Phase 1B– Tier 2 or elevate transit workers to equal consideration in the new plan alongside individuals age 65 and over and workers in health care, emergency services, food and agriculture, and education.
Updated at 8:30am, January 28
BART ridership for Wed. January 27 was 41,187, representing an 90% drop compared to budget projections for a pre-COVID-19 January weekday.
Updated at Noon, January 27
First batch of new federal emergency relief allocated to BART
Today the Metropolitan Transportation Commission (MTC) is allocating the first batch of funds from the Coronavirus Response and Relief Supplemental Appropriations Act of 2021(CRRSAA), which included $14B for public transit. This first tranche of funds is being distributed to Bay Area transit operators that received insufficient shares of CARES Act funding due to inaccurate revenue loss forecasts. Of the $180 million in funds allocated to a number of Bay Area transit systems, BART will receive $103.7 million.
“We are grateful for the MTC moving quickly to distribute this first batch of funds to help offset more of the revenue losses incurred over the last year,” said BART General Manager Bob Powers. “These funds provide short-term relief, preventing lay-offs and providing funds to keep our current service levels for our current ridership which is heavily transit dependent.” BART will still need to move forward with the March 22, 2021 schedule change which makes only slight adjustments to current service but includes running 3 route service on Saturdays.
BART will use $55 million of these funds to close the current year (FY21) deficit and the rest will help reduce the FY22 deficit. Prior to considering new federal assistance, BART anticipated a deficit of approximately $500M through the end of FY23. These new funds will reduce the forecasted deficit but an appropriate allocation of remaining CRRSAA funds will be needed to prevent further service cuts and layoffs in FY22.
“We look forward to working with the MTC on the second round of funding distribution and we will continue to advocate for additional emergency relief. The Biden Administration has proposed the American Rescue Plan with funds included to preserve public transit and prevent layoffs. While we continue to advocate for these funds, we also must continue to right size our workforce and budget through retirement incentives, shifting operating workers to capital projects, and significantly reducing non-essential overtime and other costs,” Powers said.
Updated at 8:45am, January 27
BART ridership for Tuesday, January 26 was 42,633, representing an 89% drop compared to budget projections for a pre-COVID-19 January weekday. Tuesday was the first full day of lifted shelter at home orders and a return to the color coded system.
Updated at 8:50am, January 26
BART ridership for Monday, January 25 was 43,148, representing an 89% drop compared to budget projections for a pre-COVID-19 January weekday.
Updated at 9:00am, January 25
View our passenger loading/crowding data showing the expected average number of people on board each car on specific trains for the week Jan 25-29 at www.bart.gov/crowding.
BART ridership for Sunday, January 24 was 13,746, representing an 84% drop compared to budget projections for a pre-COVID-19 January Sunday.
The BART Board of Directors will meet Thursday 1/28/21. They will get an update on BART's COVID-19 response. The presentation includes an update on federal assistance, our Employee Response Protocols, and our vaccine readiness plan.
Updated at 8:45 am, January 24
BART ridership for Saturday, January 23rd was 24,051, representing an 85% drop compared to budget projections for a pre-pandemic January Saturday.
Updated at 10:10am, January 23
BART ridership for Friday, January 22nd was 42,715, representing an 89% drop compared to budget projections for a pre-COVID 19 January weekday.
Updated at 9:30am January 22
BART ridership for Thursday, January 21 was 45,650, representing an 88% drop compared to budget projections for a pre-COVID-19 January weekday.
On Wednesday, January 27, 2021, the Metropolitan Transportation Commission will vote to allocate the first batch (approximately $180 million) of the Coronavirus Response and Relief Appropriations Act of 2021(CRRSAA) funding to Bay Area transit operators that received insufficient shares of CARES Act funding due to inaccurate revenue loss forecasts. MTC staff is proposing to allocate $103.7 million to BART.
Updated at 9am January 21
BART ridership for Wednesday, January 20 was 42,102, representing an 89% drop compared to budget projections for a pre-COVID-19 January weekday.
Updated at 8:50am January 20
BART ridership for Tuesday, January 19 was 42,807, representing an 89% drop compared to budget projections for a pre-COVID-19 January weekday.
Updated at 9am January 19
BART ridership for Monday, January 18 (MLK Holiday) was 25,337, representing an 79% drop compared to budget projections for a pre-COVID-19 January weekday holiday.
Updated at 8:30am January 18
View our passenger loading/crowding data showing the expected average number of people on board each car on specific trains for the week Jan 18-22 at www.bart.gov/crowding.
BART ridership for Sunday, January 17 was 17,388, representing an 79% drop compared to budget projections for a pre-COVID-19 January Sunday.
BART ridership for Saturday, January 16 was 23,063, representing a 85% drop compared to budget projections for a pre-COVID-19 January Saturday.
BART ridership for Friday, January 15 was 44,032, representing a 89% drop compared to budget projections for a pre-COVID-19 weekday in January.
Updated at 9:00am January 15
BART ridership for Thursday, January 14 was 44,525, representing an 89% drop compared to budget projections for a pre-COVID-19 January weekday.
Updated at 8:15am January 14
BART ridership for Wednesday, January 13 was 44,666, representing an 89% drop compared to budget projections for a pre-COVID-19 January weekday.
On January 14, 2021 the BART Board of Directors were given a budget update including new deficit numbers and new anticipated federal funds. Highlights include:
- Anticipated new federal funds will provide short-term relief; will close remaining FY21 deficit, which was previously identified as $33 million, and significantly reduce FY22 deficit, but they will not solve near- and long-term fiscal challenges
- BART must continue to work to right size workforce and budget through retirement incentives, load shedding, suppression of non-essential overtime, and other costs
- Through the end of FY23, BART anticipates a deficit of approximately $500M before federal assistance is considered
- Additional cost cutting will be necessary
Updated at 9:14am January13
BART ridership for Tuesday, January 12 was 44,203, representing an 89% drop compared to budget projections for a pre-COVID-19 January weekday.
Updated at 8:50am January 12
BART ridership for Monday, January 11 was 42,559, representing an 89% drop compared to budget projections for a pre-COVID-19 January weekday.
Updated at 9:30am, January 11-15
View our passenger loading/crowding data showing the expected average number of people on board each car on specific trains for the week Jan 11- 15 at www.bart.gov/crowding.
BART ridership for Sunday, January 10 was 15,654, representing an 81% drop compared to budget projections for a pre-COVID-19 January Sunday.
BART ridership for Saturday, January 9 was 22,221, representing a 86% drop compared to budget projections for a pre-COVID-19 January Saturday.
BART ridership for Friday, January 8 was 42,351, representing a 89% drop compared to budget projections for a pre-COVID-19 weekday in January.
Updated at 6:30 am, January 8
BART ridership for Thursday, January 7th was 43,594, representing an 89% drop compared to budget projections for a pre-COVID-19 January weekday.
Updated at 6:30 am, January 7
BART ridership for Wednesday, January 6 was 42,398, representing an 89% drop compared to budget projections for a pre-COVID-19 January weekday.
Updated at 4:15 am, January 6
BART ridership for Tuesday, January 5 was 44,162, representing an 89% drop compared to budget projections for a pre-COVID-19 January weekday.
Updated at 5:30 am, January 5
BART ridership for Monday, January 4 was 38,874, representing a 90% drop compared to budget projections for a pre-COVID-19 January weekday.
Updated at 5:45am, January 4
View our passenger loading/crowding data showing the expected average number of people on board each car on specific trains for the week Jan 4-7 at www.bart.gov/crowding.
BART ridership for Sunday, January 3 was 15,151, representing an 82% drop compared to budget projections for a pre-COVID-19 January Sunday.
Updated at 9:25am, January 3
BART ridership for Friday, January 1 was 14,108, representing a 89% drop compared to budget projections for a pre-COVID-19 weekday holiday in January.
BART ridership for Saturday, January 2 was 18,034, representing a 88% drop compared to budget projections for a pre-COVID-19 January Saturday.
Updated at 8:45am, January 1, 2021
BART ridership for Thursday, December 31 was 33,491, representing a 91% drop compared to budget projections for a December weekday.
2020 Updates
Updated at 9:15am, December 31, 2020
BART ridership for Wednesday, December 30 was 40,388, representing a 90% drop compared to budget projections for a December weekday.
Updated at 8:15am, December 30
BART ridership for Tuesday, December 29 was 40,209, representing a 90% drop compared to budget projections for a December weekday.
Check out our list of 50 accomplishments to end the year on an optimistic note.
Updated at 9:15am, December 29
BART ridership for Monday, December 28 was 38,359, representing a 90% drop compared to budget projections for a December weekday.
Updated at 12:15pm, December 28
Today BART Board President Mark Foley sent a letter to Governor Newsom advocating for the Phase 1B prioritization for public transit workers. Last Wednesday, the California Department of Public Health’s Community Vaccine Advisory Committee received an update from the California Department of Public Health’s COVID-19 Vaccine Drafting Guidelines Workgroup on the state’s evolving plan to prioritize its limited supply of COVID-19 vaccines. The workgroup revealed that, based on the interim guidance from the Centers for Disease Control and Prevention, it is recommending public transit workers be placed into Phase 1B – Tier 2 of the state’s vaccination plan, which would secure a place for public transit workers in the next phase of vaccinations, expected to come online in January 2021. The workgroup is expected to vote on its plan on December 30 then send its recommendations to Governor Newsom. Earlier this month, General Managers from Bay Area transit systems sent a letter to Governor Gavin Newsom urging him to work to ensure that transit, paratransit, and school transportation workers are prioritized along with other essential workers to receive the COVID-19 vaccine following the critical need to vaccinate the State's healthcare workers.
Updated at 11:15am, December 28
View our passenger loading/crowding data showing the expected average number of people on board each car on specific trains for the week Dec 28-Jan 1 at www.bart.gov/crowding.
BART ridership for Sunday, December 27 was 15,208, representing an 86% drop compared to budget projections for a December Sunday.
BART ridership for Saturday, December 26 was 19,153, representing an 88% drop compared to budget projections for a December Saturday.
BART ridership for Friday, December 25 (Christmas Day) was 8,106, representing an 94% drop compared to budget projections for a weekday holiday in December. Ridership for Christmas day in 2019 was 48,979.
BART ridership for Thursday, December 24 was 29,247, representing an 92% drop compared to budget projections for a December weekday.
Updated at 9:30am, December 24
BART ridership for Wednesday, December 23 was 43,854, representing an 89% drop compared to budget projections for a December weekday.
There is free COVID-19 testing at the 24th St. Station Plaza today from 7:30am-4pm with multilingual staffing including Spanish and Chinese.
Updated at 8:30am, December 23
BART ridership for Tuesday, December 22 was 44,938, representing an 88% drop compared to budget projections for a December weekday.
We continue to partner with local agencies to provide free COVID-19 testing at select stations.
▪️24th St. Station Plaza- today and tomorrow from 7:30am-4pm with multilingual staffing including Spanish and Chinese.
▪️Union City Station has drive through testing today until 4pm.
Updated at 10:15am, December 22
BART ridership for Monday, December 21 was 43,587, representing an 89% drop compared to budget projections for a December weekday.
he Metropolitan Transportation Commission (MTC) has advised BART that the combined $2.3 trillion COVID relief package approved by Congress includes $14 billion for public transit, resulting in $978 million to the Bay Area to assist transit agencies. BART will now work with the MTC and the Blue Ribbon Transit Recovery Task Force on funding allocations. We don’t yet know what amount BART will get but will provide details here once finalized.
Updated at 9:20am, December 21
View our passenger loading/crowding data showing the expected average number of people on board each car on specific trains for the week Dec 21-Dec 25 at www.bart.gov/crowding.
BART ridership for Sunday, December 20 was 17,353, representing an 84% drop compared to budget projections for a December Sunday.
BART ridership for Saturday, December 19 was 23,077, representing an 85% drop compared to budget projections for a December Saturday.
BART ridership for Friday, December 18 was 45,640, representing an 88% drop compared to budget projections for a December weekday.
Congress has reached a deal on a COVID-19 relief bill. We are hearing the bill will contain $14 billion for transit, a portion of which will flow to Bay Area systems to be divided by the Metropolitan Transportation Commission. We don’t yet know what amount BART will get. We are grateful for the short term relief. Once the legislative bill text is available we will provide more details.
Updated at 9:50am, December 18
BART ridership for Thursday, December 17 was 45,844, representing an 88% drop compared to budget projections for a December weekday.
Updated at 10:50am, December 17
BART ridership for Wednesday, December 16 was 46,428, representing an 88% drop compared to budget projections for a December weekday.
Updated at 12:20pm, December 16
BART ridership for Tuesdsay, December 15 was 46,113, representing an 88% drop compared to budget projections for a December weekday.
Updated at 10:15am, December 15
Today, December 15 is #SavePublicTransit day.
The American Public Transportation Association (APTA) is joining with BART and other members, industry partners and advocates on Tuesday, December 15 to collectively urge Congress and the Administration to #SavePublicTransit.
“Immediate action needs to be taken before Congress recesses for the holiday to address the public transportation industry’s dire financial situation so that we can continue to serve essential employees every day and can help with the nation’s economic recovery,” said APTA President and CEO Paul P. Skoutelas. “The industry’s very survival is at stake.”
The public transportation industry is facing an existential financial crisis, and emergency funding has never been more urgent. A bipartisan, bicameral coronavirus relief aid package is being discussed in the lame duck session, but that can be only a starting point for negotiations.
APTA and the industry are calling on Congress and the Administration to provide at least $32 billion in emergency funding to ensure that public transit agencies can survive and help our communities and the nation recover from the economic fallout of the pandemic.
Updated at 10:00am, December 15
BART ridership for Monday, December 14 was 44,948, representing an 88% drop compared to budget projections for a December weekday.
Updated at 12:20pm December 14
View our passenger loading/crowding data showing the expected average number of people on board each car on specific trains for the week Dec 14-Dec 18 at www.bart.gov/crowding.
BART ridership for Sunday, December 13 was 13,465, representing an 87% drop compared to budget projections for a December Sunday.
Late last week, BART completed the process of transitioning all stations to offer Clipper as the only fare product available for purchase.
Using Clipper helps this effort by allowing riders to avoid direct contact with fare gates, as the card only needs to be held over the fare gate card reader without touching. Riders can further protect themselves from contact with fare machines by loading funds onto their Clipper card online, allowing up to one day for the balance to post. For registered users, the Autoload feature will automatically replenish their Clipper balance.
While paper tickets are no longer available for purchase at these stations, riders are still be able to use paper tickets to enter or exit through fare gates. Riders are also able to add enough fare to a paper ticket to exit the station using add fare machines located inside the paid area.
Updated at 6:15am December 13
BART ridership for Saturday, December 12 was 22,282, representing an 86% drop compared to budget projections for a December Saturday.
Updated at 4:45am December 12
BART ridership for Friday, December 11 was 45,291, representing an 88% drop compared to budget projections for a December weekday.
Updated at 10:45am December 11
BART ridership for Thursday, December 10 was 46,815, representing a 88% drop compared to budget projections for a December weekday.
On December 11, 2020, BART Board President Lateefah Simon and General Manager Bob Powers penned letters to House Speaker Nancy Pelosi and to Senate Majority Leader Mitch McConnell and Minority Leader Chuck Schumer. Simon and Powers urge Congressional leaders to take "swift action in passing a COVID-19 emergency relief bill before the end of the lame duck session."
Updated at 9:15am December 10
BART ridership for Wednesday, December 9 was 47,379, representing a 88% drop compared to budget projections for a December weekday.
General Managers from Bay Area transit systems have sent a letter to Governor Gavin Newsom urging him to work to ensure that transit, paratransit, and school transportation workers are prioritized along with other essential workers to receive the COVID-19 vaccine following the critical need to vaccinate the State's healthcare workers.
Updated at 9:52am December 9th
BART ridership for Tuesday, December 8 was 47,037, representing a 88% drop compared to budget projections for a December weekday.
BART General Manager Bob Powers has joined a national coalition of the country’s leading public transportation agencies to call for significant and immediate emergency federal relief in response to the COVID-19 pandemic.
Watch the video of his statment: https://youtu.be/-ahJM2U4Sm4
Powers issued this statement on December 9, 2020:
"Since the arrival of this pandemic in the United States, the Bay Area has been at the forefront in the effort to save lives. Our region has some of the longest-lasting and most restrictive shelter-in-place orders in the country. Ridership is still down 87%. 50 thousand people are riding, instead of 410 thousand. On Monday, new shelter-in-place orders went into effect with 33 million Californians impacted by the lockdown.
At BART, we have seen a dramatic shift of who is riding and who isn’t. 75% are minority riders. 51% are from a household with income of less than $50 thousand dollars. Some of the stations in our system that used to be our busiest have seen some of the steepest declines in usage. Meanwhile, Fruitvale Station in the heart of Oakland has seen a surge in ridership to become our fifth-busiest stop.
We were among the first transit agencies in America to act in the face of this pandemic. In mid-March BART enacted a hiring freeze and implemented service cuts. We worked with our unions, standing shoulder to shoulder on our response efforts and to identify costs savings that have so far helped us to avoid layoffs. Our latest initiative is offering voluntary retirement incentives to 40% of our workforce. Perhaps most importantly BART recently agreed to a new three-year labor contract with our three largest unions to bolster our financial stability and predictability.
We used CARES ACT funding to save our operating budget and to keep the trains running and we can’t thank Congress enough for the funding. BART is now facing a $210 million in budget deficit in the current fiscal year and next.
I want to make this clear….as we ask for emergency aid from the federal government, we are committed to doing our part to be fiscally responsible.
Service level planning for next year is well underway. At BART, we are proud to continue to offer service seven days a week, although our trains are less frequent than before the pandemic. We have also been forced to close the system earlier at night. We cannot continue at our current pace without help.
The prospect of deeper cuts and gutting service is unconscionable. We can’t turn our backs on essential workers. Scaled down transit does not build resilient cities and will not help with economic recovery. Five years from now when we look back at this time, will it be the moment we widened the mobility divide, or will it be the moment we thrived in the face of challenges?
The federal government needs to answer the call."
Updated at 8:45am December 8th
BART ridership for Monday, December 7 was 45,538, representing a 88% drop compared to budget projections for a December weekday. Monday was the first day of new stay-at-home orders in several Bay Area counties. 45K is about 5,000 fewer rides compared to the last fews weeks and about 10,000 fewer rides compared to a month ago, when ridership was reaching 55K.
Updated at 9:15am December 7
View our passenger loading/crowding data showing the expected average number of people on board each car on specific trains for the week Dec 7-Dec 11 at www.bart.gov/crowding.
BART ridership for Sunday, December 6 was 18,462, representing an 83% drop compared to budget projections for a December Sunday.
BART ridership for Saturday, December 5 was 27,220, representing an 83% drop compared to budget projections for a December Saturday.
BART ridership for Friday, December 4 was 50,933, representing a 87% drop compared to budget projections for a December weekday.
Updated at 4:15am December 4
BART ridership for Thursday, December 3 was 51,826, representing an 87% drop compared to budget projections for a December weekday.
Updated at 5:30am December 3
BART ridership for Wednesday, December 2 was 51,262, representing an 87% drop compared to budget projections for a December weekday.
Updated at 5:00am December 2
BART ridership for Tuesday, December 1 was 51,474, representing an 87% drop compared to budget projections for a December weekday.
Updated at 5:45am December 1
BART ridership for Monday, November 30 was 49,140, representing an 88% drop compared to budget projections for a November weekday.
Updated at 5:30am November 30
View our passenger loading/crowding data showing the expected average number of people on board each car on specific trains for the week of Nov 30-Dec 4 at www.bart.gov/crowding.
BART ridership for Sunday, November 29 was 19,396, representing an 81% drop compared to budget projections for a November Sunday.
BART ridership for Saturday, November 28 was 25,882, representing an 82% drop compared to budget projections for a November Saturday.
BART ridership for Friday, November 27 was 31,979, representing a 92% drop compared to budget projections for a November weekday.
Updated at 10am November 27
BART ridership for Thursday, November 26 (Thanksgiving) was 13,628, representing a 93% drop compared to budget projections for a weekday holiday in November.
BART ridership for Wednesday, November 25 was 49,091, representing an 88% drop compared to November budget projection.
Updated at 9am November 25
BART ridership for Tuesday, November 24 was 52,091, representing an 87% drop compared to November budget projection.
Updated at Noon Tuesday November 24
BART ridership for Monday, November 23 was 50,256, representing an 88% drop compared to November budget projection.
Updated at 8:50am Monday November 23
View our passenger loading/crowding data showing the expected average number of people on board each car on specific trains for the week of Nov 23-Nov 27 at www.bart.gov/crowding.
BART ridership for Sunday, November 22 was 19,975, representing an 81% drop compared to November budget projections.
BART ridership for Saturday, November 21 was 28,092, representing an 81% drop compared to November budget projections.
BART ridership for Friday, November 20 was 52,703, representing an 87% drop compared to November budget projections.
Updated at 8:50am November 20
BART ridership for Thursday, November 19 was 53,004, representing an 87% drop compared to November budget projections.
Yesterday the BART Board of Directors approved a retirement incentive program as part of our efforts to reduce our budget deficit brought on by the COVID-19 pandemic. View the details of the plan.
These actions are while we continue our relentless advocacy for federal emergency aid to save transit.
BART needs to start planning now for the next schedule change, which would take effect March 22, 2021 and last until September 2021. We have to balance ridership, equity, social distancing, ability to ramp back up, and costs (jobs and operating expenses).
Staff advised the board we are moving towards the following service plan for March 2021:
- Running the same hours we currently operate with 30 minute frequencies and 18 extra commute direction trips for 15 min frequencies but eliminating 8 reverse commute trips
- Running 3 route service on Saturday (like we do on Sunday)
If things recover and we get robust emergency aid, we can flex up and add more service and extend hours with overtime and we can work with our unions to do an off-schedule bid.
Updated at 10:13am November 19
BART ridership for Wednesday, November 18 was 51,845, representing an 87% drop compared to November budget projections.Today the BART Board of Directors are meeting and will get an update on our budget deficit reduction actions and service planning for next year. View the presentation.
Watch the board meeting: http://www.bart.gov/about/bod/multimedia
Updated at 12:26pm November 18
BART ridership for Tuesday, November 17 was 49,265, representing an 88% drop compared to November budget projections. Tuesday was the first day of Bay Area counties reverting back to more restrictive categories in the purple and red tiers on the state's scale for reopening.
Updated at 8:45am November 17
BART ridership for Monday, November 16 was 52,357, representing an 87% drop compared to November budget projections. Today is the first day of Bay Area counties reverting back to more restrictive categories in the purple and red tiers on the state's scale for reopening.
Updated at 9:30am November 16
View our passenger loading/crowding data showing the expected average number of people on board each car on specific trains for the week of Nov 16-Nov 20 at www.bart.gov/crowding.
BART ridership for Sunday, November 15 was 21,465, representing an 79% drop compared to November budget projections.
BART ridership for Saturday, November 14 was 29,366, representing an 80% drop compared to November budget projections.
BART ridership for Friday, November 13 was 51,597, representing an 87% drop compared to November budget projections.
Updated at 8:15am November 13
BART ridership for Thurday, November 12 was 55,171, representing an 87% drop compared to November budget projections.
Updated at 9:15am November 12
BART ridership for Wednesday, November 11 (Veterans Day Holiday) was 46,593, representing an 76% drop compared to November budget projections for a weekday holiday.
BART ridership for Tuesday, November 10 was 54,464, representing an 87% drop compared to November budget projections.
Updated at 11:25am November 10
BART ridership for Monday, November 9 was 51,850, representing an 87% drop compared to November budget projections.
Updated at 11am November 9
View our passenger loading/crowding data showing the expected average number of people on board each car on specific trains for the week of Nov 9-Nov 13 at www.bart.gov/crowding.
BART ridership for Sunday, November 8 was 21,228, representing an 79% drop compared to November budget projections.
BART ridership for Saturday, November 7 was 32,083, representing an 78% drop compared to November budget projections.
BART ridership for Friday, November 6 was 54,607, representing an 87% drop compared to November budget projections.
Updated at 9:15am November 6
BART ridership for Thursday, November 5 was 54,566, representing an 87% drop compared to November budget projections.
Updated at 9:15am November 5
BART ridership for Wednesday, November 4 was 51,903, representing an 87% drop compared to November budget projections.
Updated at 9:15am November 4
BART ridership for Tuesday, November 3 was 52,036, representing an 87% drop compared to November budget projections.
Updated at 8:50am November 3
BART ridership for Monday, November 2 was 53,287, representing an 87% drop compared to November budget projections.
Updated at 9:15am November 2
View our passenger loading/crowding data showing the expected average number of people on board each car on specific trains for the week of Nov 2-Nov 6 at www.bart.gov/crowding.
BART ridership for Sunday, November 1 was 22,698, representing an 78% drop compared to November budget projections.
BART ridership for Saturday, October 31st was 30,152, representing an 81% drop compared to October budget projections.
BART ridership for Friday, October 30th was 55,705, representing an 87% drop compared to October budget projections, marking the new highest ridership day since shelter in place orders began.
Updated at 9:15am, October 30
BART ridership for Thursday, October 29 was 55,360, representing an 87% drop compared to October budget projections, marking the new highest ridership day since shelter in place orders began and the second time we topped 55K.
Updated at 10:30am, October 29
BART ridership for Wednesday, October 28th was 54,906, representing an 87% drop compared to October budget projections.
Updated at 9:47am, October 28
BART ridership for Tuesday, October 27th was 54,337, representing an 87% drop compared to October budget projections.
Updated at 9:15am, October 27
BART ridership for Monday, October 26th was 50,927, representing an 88% drop compared to October budget projections.
Updated at 10:25am, October 26
View our passenger loading/crowding data showing the expected average number of people on board each car on specific trains for the week of Oct 26-Oct 30 at www.bart.gov/crowding.
BART ridership for Sunday, October 25th was 22,122, representing an 80% drop compared to October budget projections.
BART ridership for Saturday, October 24th was 30,724, representing an 81% drop compared to October budget projections.
Updated at 8:20am, October 24
BART ridership for Friday, October 23 was 55,187, representing an 87% drop compared to October budget projections, marking the new highest ridership day since shelter in place orders began and the first time we topped 55K.
Updated at 8:50am, October 23
BART ridership for Thursday, October 22 was 54,513, representing an 87% drop compared to October budget projections.
Update at 8:36am, October 22
BART ridership for Wednesday, October 21 was 54,514, representing an 87% drop compared to October budget projections, marking the new highest ridership day since shelter in place orders began.
Today our Board of Directors are meeting and will get an update on BART's budget challeneges brought on by COVID-19. View the presentation and read the summary.
Watch the board meeting starting at 9am at https://www.bart.gov/about/bod/multimedia
To provide public virtual comment, join the Board meeting via zoom: call 1-669-900-6833 and enter access code 947 8999 4186.
The budget update includes this visual that shows which stations have sustained ridership during the pandemic and which ones have not.
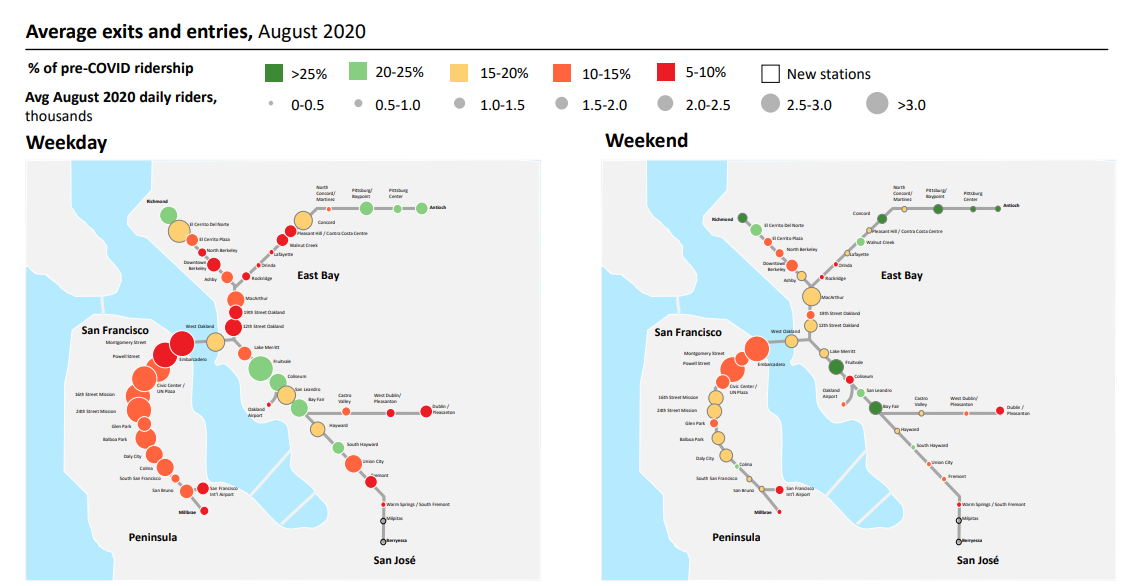
Updated at 8:45am, October 21
BART ridership for Tuesday, October 20th was 53,785, representing an 87% drop compared to October budget projections.
BART outlines 7-point plan for responding to budget crisis brought on by COVID-19
While BART’s daily weekday ridership has been increasing steadily for several weeks, the path to regaining ridership will be a slow climb and the COVID-19 pandemic has had a devastating impact of our short and long-term operating budget shortfalls.
As of mid-October, BART ridership hovers at 13% of pre-COVID levels and may not exceed 40% by the end of FY21. Ridership drives our operating budget because BART relies on fare revenue more than most transit agencies. About 70% of our operating revenue comes from fares. To ensure that BART is on the strongest fiscal footing possible, BART General Manager Bob Powers has developed a 7-point plan with concrete steps to reduce costs annually and maximize efficiencies to address anticipated short-term and long-term deficits quickly, equitably, and strategically.
“The 7-point plan is a critical part of our effort to keep cost reductions as far from the riders as possible and to support our workforce,” BART General Manager Bob Powers.
The 7-point plan includes steps we will take to maximize efficiency and find savings before cutting service:
- Pursue efficiencies around contracting and other reductions to BART’s non-labor budget
- Continue hiring freeze; eliminate most current vacancies
- Seek Board approval to negotiate a retirement incentive program with union leadership
- Re-assign or re-train staff wherever possible to fill critical gaps created by departures
- Fill critical capital budget vacancies with operating staff wherever possible
- Load shed service dependent staff to capital projects to accelerate capital program delivery
- Explore additional cost savings measures with labor partners and non-represented employees
The 7-point plan will be reviewed during the October 22, 2020 Board of Directors meeting. View the presentation.
BART’s current fiscal year funding gap is $33 million. Federal CARES Act funding, in addition to the immediate cost cutting measures BART implemented at the onset of the pandemic, has helped stabilize our cashflow through Q3 of FY21.
The savings from the 7-point plan will help us close the current year gap and become leaner in future years, but we must have contingency plans in case there is no more help from the federal government or other emergency aid. We also must address long-term budget shortfalls because we know ridership will be impacted possibly for years to come.
Five priorities to balance tradeoffs in service changes
As part of our contingency plans, we are considering a number of scenarios and options. Some are painful, including closing some stations and closing on the weekend. This is something we will fight to prevent. We will continue to advocate for emergency funds and work with our labor partners to find cost savings to prevent cutting service.
BART is using five priorities to balance tradeoffs in service changes
- Ridership- How can we maximize resources to attract more riders as people return to work and make transportation decisions?
- Financial- What service is the most cost effective for BART’s limited budget while minimizing impacts to labor?
- Equity- How can we minimize impacts to protected populations?
- Capacity recovery- How responsive is the service plan in preserving the capability and expertise necessary to scale-up to assist in the economic recovery of the Bay Area as counties re-open and ridership potential grows?
- Health Guidance- How well do service levels meet public health guidelines and aid in regaining confidence from riders and employers contemplating bringing workers back into the office?
BART has consistently taken a data-driven, transparent approach to service changes in response to the COVID-19 pandemic. We’ve continued to prioritize our riders and employees. Over the coming weeks, BART staff will continue to cost out savings achieved from the 7-point plan and various service scenarios. Staff will provide an update to the Board of Directors on November 19, 2020 when staff will review a preferred service plan that would take effect in February 2021.
Our commitment is to do all we can to serve the region and support the Bay Area economy and our workforce while also making sure we appropriately respond to the immediate fiscal crisis and the longer-term deficit COVID-19 has exacerbated.
Updated at 8:45am, October 20th
BART ridership for Monday, October 19th was 51,624, representing an 88% drop compared to October budget projections.
Updated at 9:20am, October 19th
View our passenger loading/crowding data showing the expected average number of people on board each car on specific trains for the week of Oct 19-Oct 23rd at www.bart.gov/crowding.
BART ridership for Sunday, October 18th was 21,609, representing an 80% drop compared to October budget projections.
BART ridership for Saturday, October 17th was 30,736, representing an 81% drop compared to October budget projections.
BART ridership for Friday, October 9th was 53,412, representing an 87% drop compared to October budget projections.
Updated at 10:40am, October 16th
BART ridership for Thursday, October 15th was 54,067, representing an 87% drop compared to October budget projections, marking the new highest ridership day since shelter in place orders began.
Updated at 8:30am, October 15th
BART ridership for Wednesday, October 14th was 53,138, representing an 87% drop compared to October budget projections, marking the new highest ridership day since shelter in place orders began.
Updated at 9:30am, October 14th
BART ridership for Tuesday, October 13th was 52,731, representing an 88% drop compared to October budget projections.
Updated at 11:30am, October 13th
BART ridership for Monday, October 12th (a federal US holiday) was 45,029, representing an 87% drop compared to budget projections for a holiday in October.
Updated at 9:30am, October 12
View our passenger loading/crowding data showing the expected average number of people on board each car on specific trains for the week of Oct 12-Oct 16th at www.bart.gov/crowding.
BART ridership for Sunday, October 11th was 21,871, representing an 80% drop compared to October budget projections.
BART ridership for Saturday, October 10th was 29,692, representing an 82% drop compared to October budget projections.
BART ridership for Friday, October 9th was 52,860, representing an 88% drop compared to October budget projections, marking the new highest ridership day since shelter in place orders began.
Last week was the first week ridership was 50K+ each day Monday-Friday.
Updated at 11:40am, October 9th
BART ridership for Thursday, October 8th was 52,685, representing an 88% drop compared to October budget projections, marking the new highest ridership day since shelter in place orders began.
Updated at 12:20pm, October 8th
BART ridership for Wednesday, October 7th was 52,639, representing an 88% drop compared to October budget projections, marking the new highest ridership day since shelter in place orders began.
Updated at 5:00am, October 7th
BART ridership for Tuesday, October 6th was 52,126, representing an 88% drop compared to October budget projections.
Updated at 4:30am, October 6th
BART ridership for Monday, October 5th was 50,086, representing an 88% drop compared to October budget projections. This is the first time Monday ridership has hit the 50K mark, representing a strong start to the work week.
Updated at 8:30am, October 5th
View our passenger loading/crowding data showing the expected average number of people on board each car on specific trains for the week of Oct 5-Oct 9th at www.bart.gov/crowding.
BART ridership for Sunday, October 4th was 21,308, representing an 81% drop compared to October budget projections.
BART ridership for Saturday, October 3rd was 28,261, representing an 82% drop compared to October budget projections.
BART ridership for Friday, October 2nd was 51,497, representing an 88% drop compared to October budget projections.
Updated at 9am, October 2
BART ridership for Thursday, October 1st was 52,349, representing an 88% drop compared to October budget projections marking the new highest ridership day since shelter in place orders began.
Updated at 11:30am, October 1
BART ridership for Wednesday, September 30 was 51,754, representing an 88% drop compared to September budget projections marking the highest ridership day since shelter in place orders began.
Updated at 11am, September 30
BART ridership for Tuesday, September 29 was 51,032, representing an 88% drop compared to September budget projections.
Tomorrow BART will host a pop up event at Civic Center from 10am-Noon in the free area on the concourse level on the north end. Berkeley multidisciplinary artist Tosha Stimage will provide free packets assembled with artwork on pre-stamped post cards, face masks that can be decorated at home, and disinfecting wipes. There will also be a video compilation playing on loop, and free personal hand straps to be given out while supplies last. Read more about this art project.
Updated at 1pm, September 29
BART ridership for Monday, September 28 was 47,674, representing an 89% drop compared to September budget projections.
Updated at 9:30am, September 28
View our passenger loading data showing the expected average number of people on board each car on specific trains for the week of Sept 28-Oct 2nd at www.bart.gov/crowding.
BART ridership for Sunday, September 27 was 20,579, representing an 81% drop compared to September budget projections.
BART ridership for Saturday, September 26 was 28,242, representing an 82% drop compared to September budget projections.
BART ridership for Friday, September 25 was 51,085, representing an 88% drop compared to September budget projections.
Updated at 9:30am, September 25
BART ridership for Wednesday, September 23 was 51,174, representing a 88% drop compared to September budget projections.
Updated at 9am, September 24
BART ridership for Wednesday, September 23 was 51,343, representing a 88% drop compared to September budget projections, marking the highest ridership day since shelter in place orders began.
Today BART will host a pop up event at Civic Center from 10am-Noon in the free area on the concourse level at the 8th and Market entrance. Berkeley multidisciplinary artist Tosha Stimage will provide free packets assembled with artwork on pre-stamped post cards, face masks that can be decorated at home, and disinfecting wipes. There will also be a video compilation playing on loop, and free personal hand straps to be given out while supplies last. Read more about this art project. Another event will be held at Civic Center on Thursday Oct. 1 from 10am-noon.
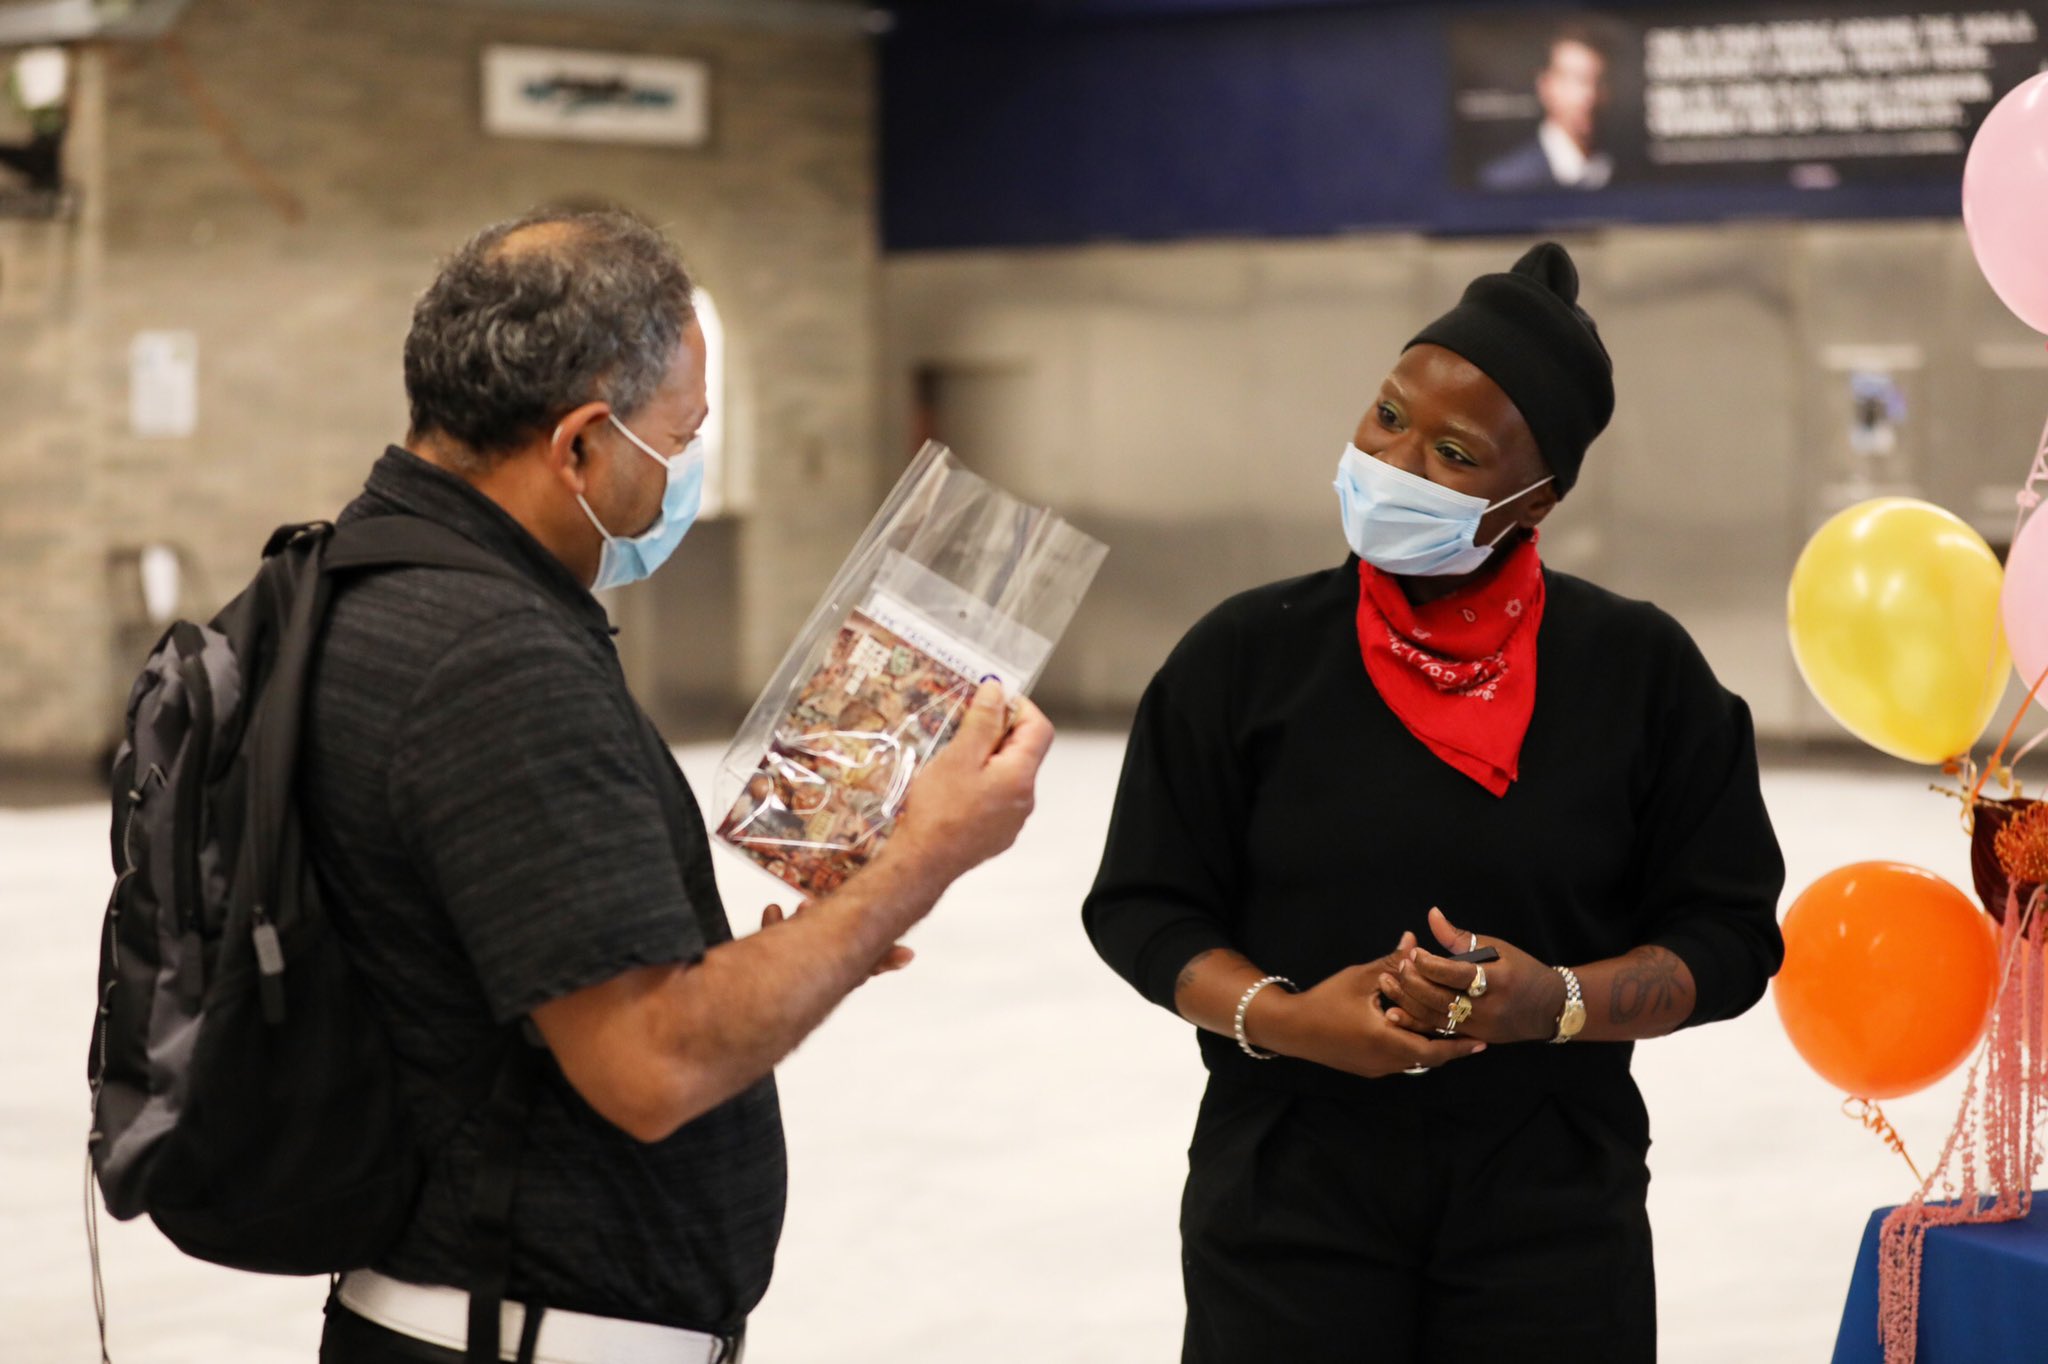
Updated at 12:20pm, September 23
BART ridership for Tuesday, September 22 was 50,240, representing a 88% drop compared to September budget projections, marking the highest ridership day since shelter in place orders began.
Updated at 9am, September 22
BART ridership for Monday, September 21th was 47,864, representing a 89% drop compared to September budget projections.
Updated at 11:30am September 21
View our passenger loading data showing the expected average number of people on board each car on specific trains for the week of Sept 21-Sept 25th at www.bart.gov/crowding. These are the first set of crowding charts since our schedule change that added more trains into service during peak commute times.
BART ridership for Sunday, September 20th was 19,202, representing a 82% drop compared to September budget projections.
BART ridership for Saturday, September 19th was 26,477, representing an 83% drop compared to September budget projections.
BART ridership for Friday September 18th was 49,921, representing an 88% drop compared to September budget projections.
Updated at 9:45am, September 18
BART ridership for Thursday, September 17th was 50,119 representing an 88% drop compared to September budget projections, marking the highest ridership day since shelter in place orders began.
Updated at 8:54am, September 17
BART ridership for Wednesday, September 16th was 49,818 representing an 88% drop compared to September budget projections, marking the highest ridership day since shelter in place orders began.
Updated at 9:15am, September 16th
BART ridership for Tuesday, September 15th was 48,427 representing an 89% drop compared to September budget projections.
Updated at 8:45am, September 15th
BART ridership for Monday, September 14th was 45,657 representing an 89% drop compared to September budget projections.
Updated at 9:00am, September 14th
BART ridership for Sunday, September 13th was 9,933, representing a 91% drop compared to September budget projections. BART had multi-hour delayed start to service on this day. Read about what happened.
Updated at 5:30pm, September 13th
BART ridership for Saturday, September 12th was 22,631, representing an 85% drop compared to September budget projections.
Updated at 4:30pm September 12
BART ridership for Friday September 11 was 45,506, representing an 89% drop compared to September budget projections.
Updated at 9am September 11 (BART's 48th birthday)
BART ridership for Thursday September 10 was 46,832, representing an 89% drop compared to September budget projections.
Next week starts our new schedule with added trains during our busiest hours to help with social distancing. Read about the new schedule.
Crowding charts will not be released on Monday because it is a new schedule and we need a few days to analyze the crowding data based on the increase in frequency. Once we have that baseline we will release charts reflective of what to expect.
The BART Board of Directors met yesterday and was given an update about ridership trends. View the presentation.
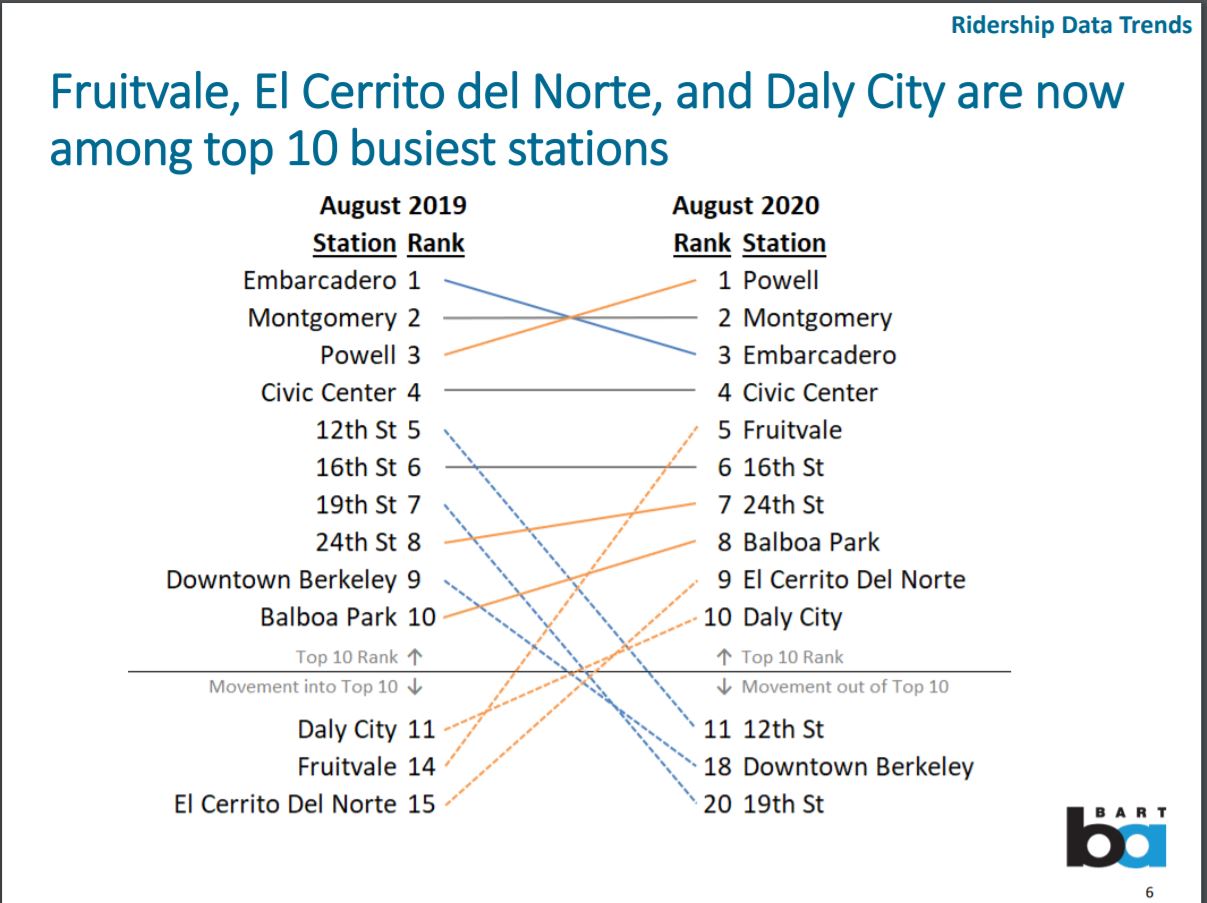
Updated at 8:30am September 10
BART ridership for Wednesday September 9 was 45,437, representing an 89% drop compared to September budget projections.
Updated at 9:20am September 9
BART ridership for Tuesday September 8 was 47,513, representing an 89% drop compared to September budget projections.
On Monday September 14th, BART’s schedule will be updated to add more frequency during peak commute times on several lines, marking the largest weekday service increase since the COVID-19 pandemic hit. Commute trains at 15-minute frequencies will be added to most lines as well as other adjustments to the schedule including 30-minute frequencies on Saturday and Sunday to reflect current ridership levels. Read the full details.
Updated at 9:45am September 8
View our passenger loading data showing the expected average number of people on board each car on specific trains for the week of Sept 7-Sept 11th at www.bart.gov/crowding.
BART ridership for Monday September 7 (Labor Day), was 19,731, representing an 82% drop compared to September budget projections.
BART ridership for Sunday, September 6 was 18,596, representing an 83% drop compared to September budget projections.
BART ridership for Saturday, September 5 was 25,622, representing an 83% drop compared to September budget projections.
BART ridership for Friday, September 4 was 47,772, representing an 89% drop compared to September budget projections.
Updated at 10am Sept 4th
BART ridership for Thursday, September 3 was 49,007, representing an 88% drop compared to September budget projections, marking the highest ridership day since shelter in place orders began.
Updated at 9:20am September 3
BART ridership for Wednesday, September 2 was 48,344, representing an 89% drop compared to September budget projections, marking the highest ridership day since shelter in place orders began.
Today, BART is installing new foot pump hand sanitizer stations at the 19th street station. These units are less prone to vandalism and can also be found at all downtown San Francisco stations. ADA accessible units are also available at every station. All BART stations have hand sanitizer stations and staff performs a quality inspection once a week to ensure they are full, are in working order, and the units haven't been removed.
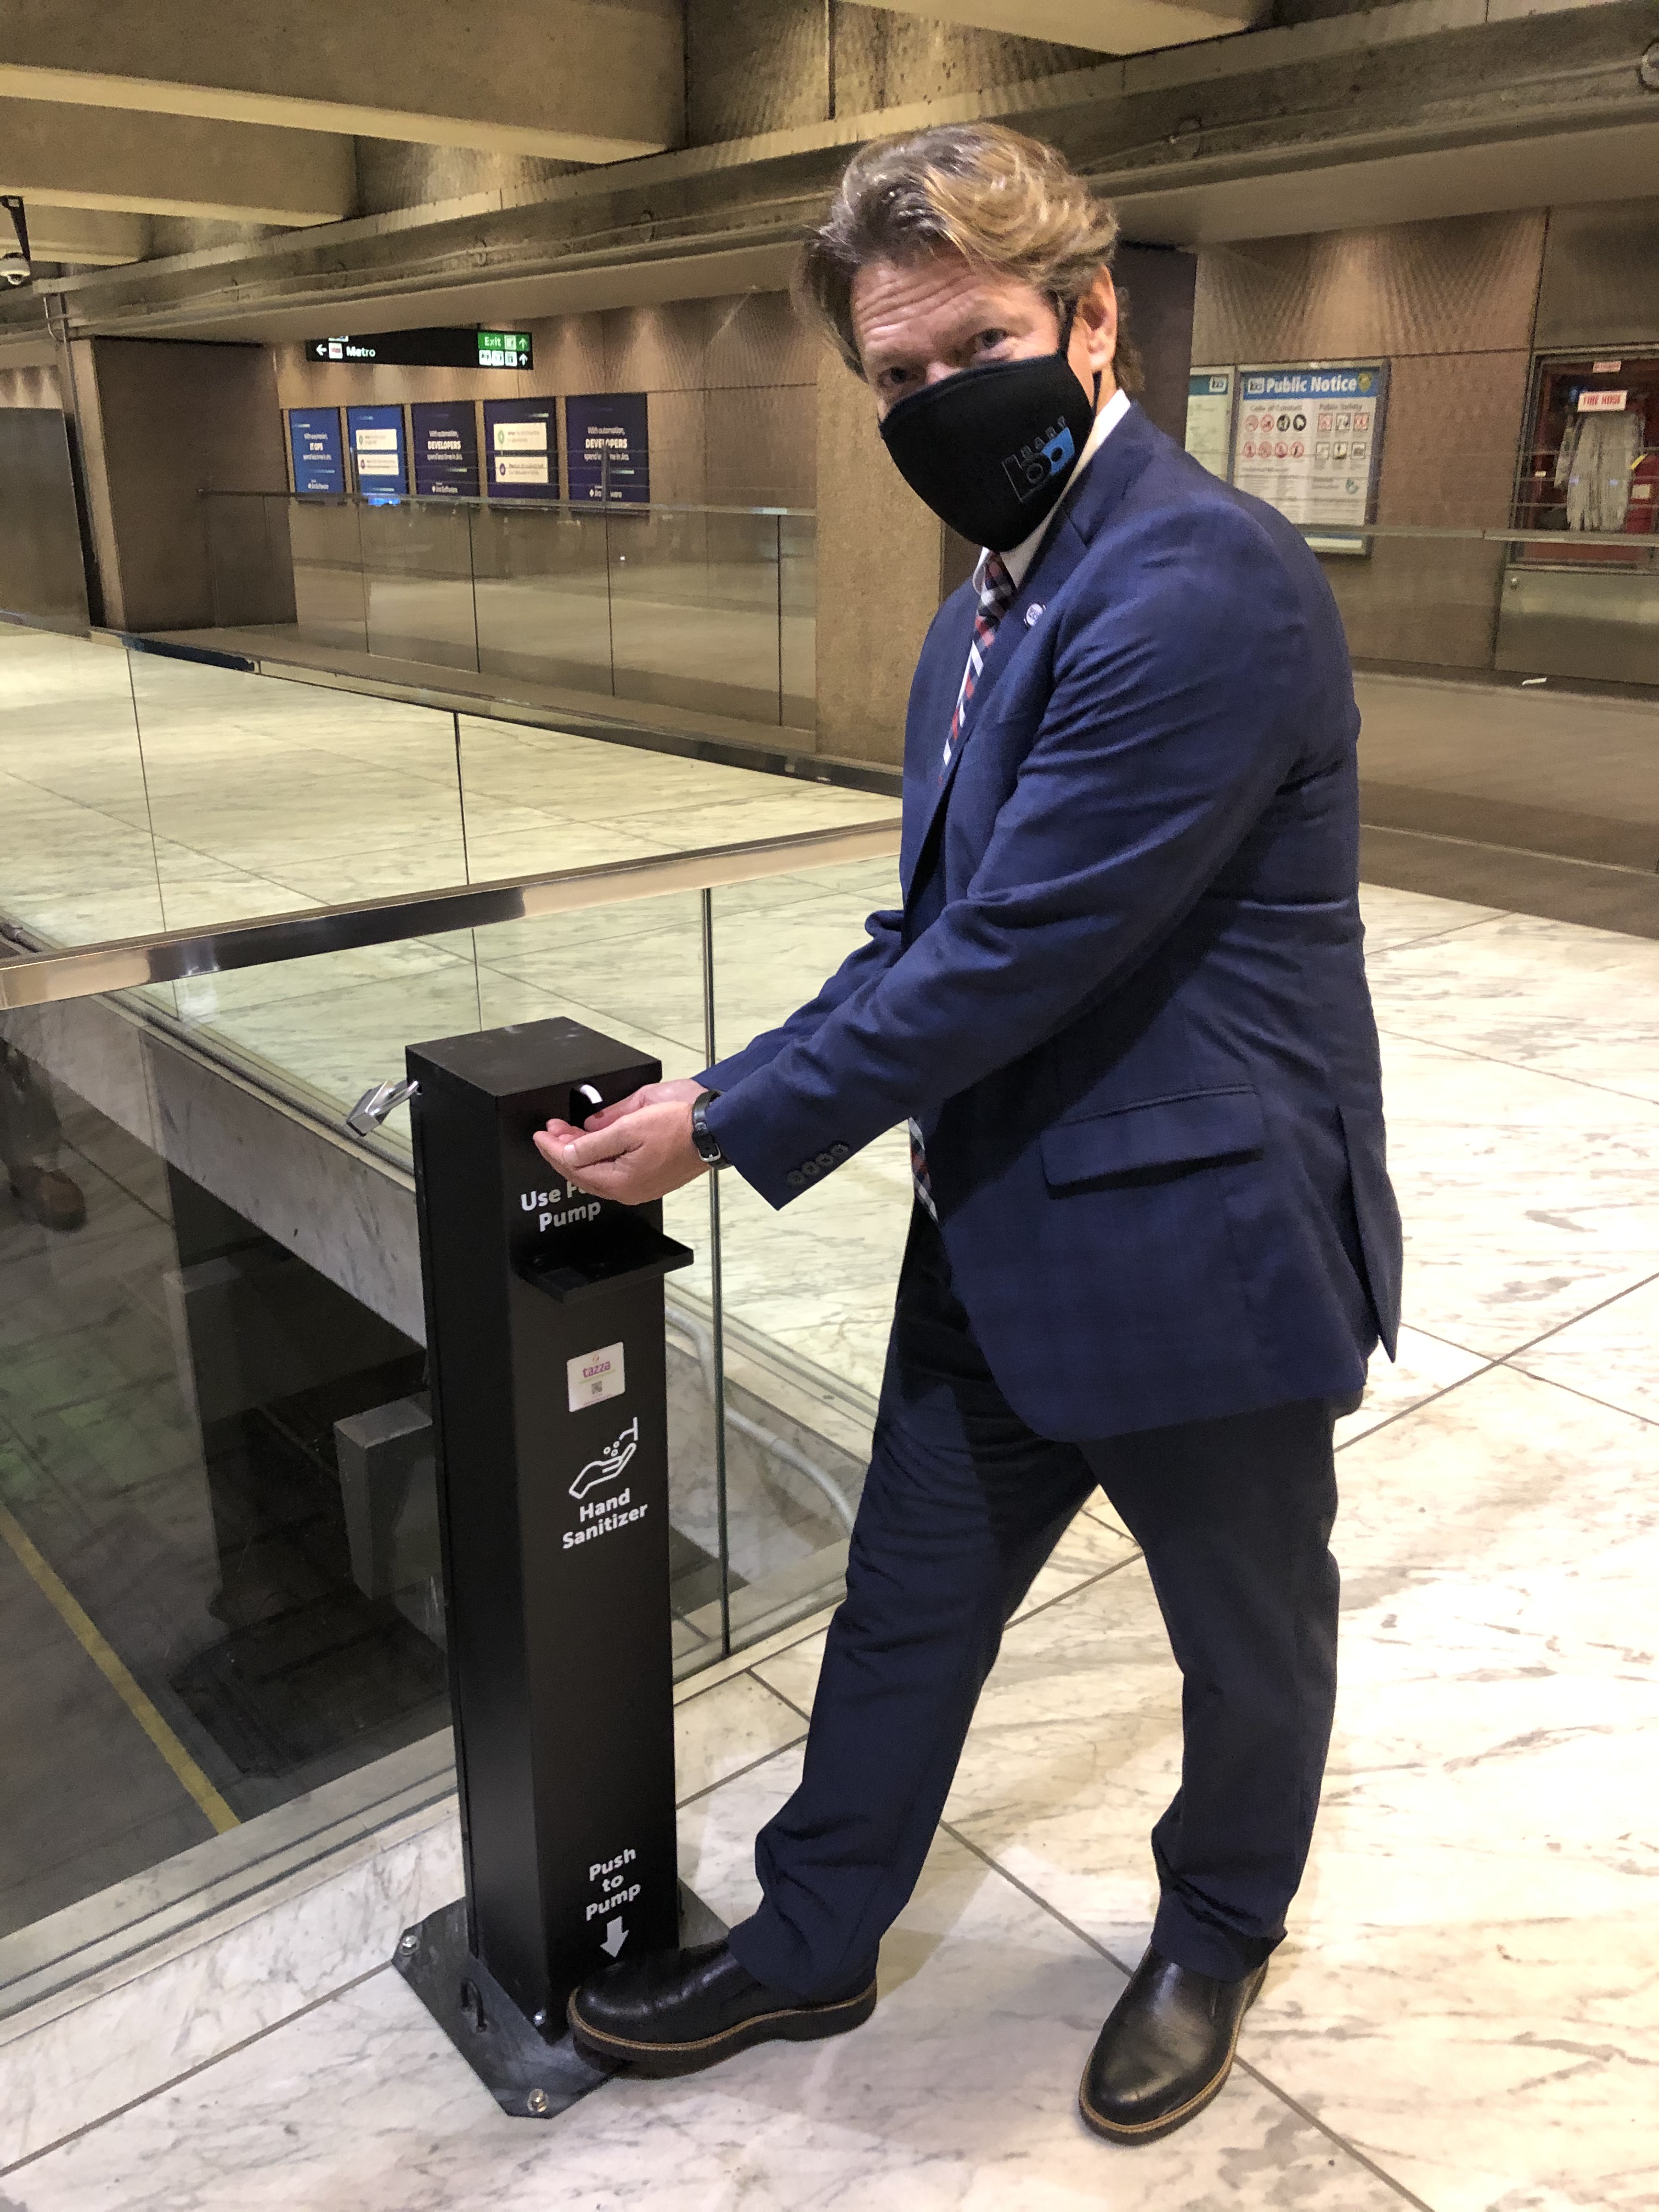
Updated at 11:30am September 2
BART ridership for Tuesday, September 1 was 47,764, representing an 89% drop compared to September budget projections, marking the highest ridership day since mid-March.
Updated at 11:15am September 1
BART ridership for Monday, August 31 was 45,329, representing an 89% drop compared to August budget projections. Ridership for the Milpitas and Berryessa stations was 362 exits.
Updated at 9:40am August 31
View our passenger loading data showing the expected average number of people on board each car on specific trains for the week of August 31-Sept 4th at www.bart.gov/crowding.
BART ridership for Sunday, August 30 was 18,234, representing an 82% drop compared to August budget projections. Ridership for the Milpitas and Berryessa stations was 303 exits.
BART ridership for Saturday, August 29 was 24,322, representing an 84% drop compared to August budget projections. Ridership for the Milpitas and Berryessa stations was 376 exits.
BART ridership for Friday, August 28 was 46,394, representing an 89% drop compared to August budget projections. Ridership for the Milpitas and Berryessa stations was 437 exits.
Updated at 9:45am August 28
BART ridership for Thursday, August 27 was 47,282, representing an 89% drop compared to August budget projections. Ridership for the Milpitas and Berryessa stations was 375 exits.
BART is continuing to make the most of the reduction in service hours due to the pandemic by advancing critical rebuilding projects that will enhance the reliability of the system. Doing as much work as possible now means fewer service impacts for the public when ridership increases. Learn more about the latest progress: https://www.bart.gov/news/articles/2020/news20200330
Updated at 9am August 27
BART ridership for Wednesday, August 26 was 46,899, representing an 89% drop compared to August budget projections. Ridership for the Milpitas and Berryessa stations was 384 exits.
Updated at 10am August 26
BART ridership for Tuesday, August 25 was 46,231, representing an 89% drop compared to August budget projections. Ridership for the Milpitas and Berryessa stations was 377 exits.
Updated at 2:15pm August 25
BART ridership for Monday, August 24 was 44,347, representing an 89% drop compared to August budget projections. Ridership for the Milpitas and Berryessa stations was 363 exits.
Updated at 9am August 24
View our passenger loading data showing the expected average number of people on board each car on specific trains for the week of August 24th-August 28th at www.bart.gov/crowding.
BART ridership for Sunday, August 23 was 16,462, representing an 84% drop compared to August budget projections. Ridership for the Milpitas and Berryessa stations was 205 exits.
BART ridership for Saturday, August 22 was 22,486, representing an 86% drop compared to August budget projections. Ridership for the Milpitas and Berryessa stations was 260 exits.
BART ridership for Friday, August 21 was 45,449, representing an 89% drop compared to August budget projections. Ridership for the Milpitas and Berryessa stations was 392 exits.
Updated at 9:30am August 21
BART ridership for Thursday, August 20, was 46,162, representing an 89% drop compared to August budget projections. Ridership for the Milpitas and Berryessa stations was 418 exits.
Updated at 9:50am August 20
BART ridership for Wednesday, August 19, was 46,316, representing an 89% drop compared to August budget projections. Ridership for the Milpitas and Berryessa stations was 370 exits.
Updated at 9:15am August 19
BART ridership for Tuesday, August 18, was 46,699, representing an 89% drop compared to August budget projections. Ridership for the Milpitas and Berryessa stations was 382 exits.
Today transit operators in the nine Bay Area counties are launching the "Riding Together: Bay Area Healthy Transit Plan" at a news conference in San Francisco. The Plan is a comprehensive strategy with shared commitments to unify the transit operator’s aggressive actions to limit the spread of coronavirus (COVID-19). Outlining action items ranging from disinfecting to ventilation, the Plan is the result of an unprecedented joint effort by transit leaders to lead the Bay Area’s transit operators into recovery mode.
In addition to serving as a tool for public transit agencies on various safety initiatives, the plan makes a call for action to riders. The implementation of mitigation steps is based on best practices from peer agencies across the globe. The commitments are also based on information from the California Department of Public Health, U.S. Centers for Disease Control and Prevention, and the World Health Organization.
Read the full plan at http://www.healthytransitplan.com/
Updated at 11am August 18
BART ridership for Monday, August 17, was 43,891, representing an 89% drop compared to August budget projections. Ridership for the Milpitas and Berryessa stations was 356 exits.
Updated at 2pm August 17
BART ridership for Sunday, August 16, was 16,006, representing an 84% drop compared to August budget projections. Ridership for the Milpitas and Berryessa stations was 310 exits.
View our passenger loading data showing the expected average number of people on board each car on specific trains for the week of August 17-August 21st at www.bart.gov/crowding.
Updated at 8:45am August 16
BART ridership for Saturday, August 15, was 23,380, representing an 85% drop compared to August budget projections. Ridership for the Milpitas and Berryessa stations was 310 exits.
Updated at 8:45am August 15
BART ridership for Friday, August 14 was 45,321, representing an 89% drop compared to August budget projections. Ridership for the Milpitas and Berryessa stations was 419 exits.
Updated at 6:30 am August 14
BART ridership for Thursday, August 13 was 46,740, representing an 89% drop compared to August budget projections. Ridership for the Milpitas and Berryessa stations was 385 exits.
Updated at 5:45am August 13
BART ridership for Wednesday, August 12 was 46,863, representing an 89% drop compared to August budget projections. Ridership for the Milpitas and Berryessa stations was 422 exits.
Today, BART published a detailed report on air flow inside BART train cars. BART train cars filter and replace indoor air about every 70 seconds, or more than 50 times an hour.
BART is also pushing the envelope on what is possible in the area of filtration, with air exchange that compares favorably to other transit systems. Two new pilot projects are being tested at BART in August: a higher-grade, denser filter panel (MERV-14 filter) that will trap smaller particles, and an ultraviolet (UV-C) light source inside the HVAC unit that can zap a virus.
Updated at 5:45am August 12
BART ridership for Tuesday, August 11 was 46,245, representing an 89% drop compared to August budget projections. Ridership for the Milpitas and Berryessa stations was 348 exits.
Updated at 9:03am August 11
BART ridership for Monday, August 10 was 46,149, representng an 89% drop compared to August budget projections. Ridership for the Milpitas and Berryessa stations was 352 exits.
Updated at 7:25am August 10
BART ridership for Sunday, August 9 was 17,962, representing an 83% drop compared to August budget projections. Ridership for the Milpitas and Berryessa stations was 277 exits.
View our passenger loading data showing the expected average number of people on board each car on specific trains for the week of August 10th-August 14th at www.bart.gov/crowding.
BART ridership for Saturday, August 8 was 23,595, representing an 85% drop compared to August budget projections. Ridership for the Milpitas and Berryessa stations was 346 exits.
BART ridership for Friday, August 7 was 46,015, representing an 89% drop compared to August budget projections. Ridership for the Milpitas and Berryessa stations was 375 exits.
Updated at 11:05am August 7
BART ridership for Thursday, August 6 was 46,782, representing an 89% drop compared to August budget projections. Ridership for the Milpitas and Berryessa stations was 381 exits.
Updated at 1:50pm August 6
BART ridership for Wednesday, August 5 was 46,389, representing an 89% drop compared to August budget projections. Ridership for the Milpitas and Berryessa stations was 373 exits.
Updated at 9am August 5
BART ridership for Tuesday, August 4 was 45,897, representing an 89% drop compared to August budget projections. Ridership for the Milpitas and Berryessa stations was 370 exits.
View our latest COVID-19 Financial Impacts Fact Sheet updated August 2020
Today at 11am BART General Manager will participate in the Save Public Transit Rally.
REGISTER: https://zoom.us/webinar/register/WN_H5iebqMlRUKL3XMb0ZBMBw
Updated at 9:15am August 4
BART ridership for Monday, August 3 was 45,111, representing an 89% drop compared to August budget projections. Ridership for the Milpitas and Berryessa stations was 382 exits.
BART General Manager to Speak at Save Public Transit Rally On Wednesday
With Congress negotiating COVID-19 relief legislation, public transit agencies, advocacy organizations, and unions from cities across the country will hold a rally this Wednesday to strongly urge Congress to provide at least $32 billion in emergency operating aid for transit. Massive reductions in transit revenue—a result of plummeting ridership and reduced tax receipts from COVID-19 shutdowns—is threatening the viability of public transit systems, putting millions of Americans’ access to jobs, healthcare, grocery stores, and other services essential to surviving the pandemic at risk.
BART General Manager Bob Powers will speak at the virtual Save Public Transit Rally. Event organizers have also identified a local Bay Area transit rider who will speak during the event. BART is encouraging the public to register and join the effort to #SaveTransit
WHEN: Wednesday August 5, 11:00 AM PDT
REGISTER: https://zoom.us/webinar/register/WN_H5iebqMlRUKL3XMb0ZBMBw
View our latest COVID-19 Financial Impacts Fact Sheet updated August 2020
Updated at 11:15am August 3
BART ridership for Sunday, August 2 was 17,192 representing an 83% drop compared to August budget projections. Ridership for the Milpitas and Berryessa stations was 281 exits.
BART ridership for Saturday, August 1 was 24,892, representing an 84% drop compared to August budget projections. Ridership for the Milpitas and Berryessa stations was 243 exits.
BART ridership for Friday, July 31 was 45,818, representing an 89% drop compared to July budget projections. Ridership for the Milpitas and Berryessa stations was 439 exits.
View our passenger loading data showing the expected average number of people on board each car on specific trains for the week of August 3rd-August 7th at www.bart.gov/crowding.
Updated at 9am July 31
BART ridership for Thursday, July 30 was 45,899, representing an 89% drop compared to July budget projections. Ridership for the Milpitas and Berryessa stations was 367 exits.
Today is the second day of offering free COVID-19 testing at our 24th Street Station as part of our partnership with UCSF and community organizations serving the Mission. 500 people were tested on the first day (Wednesday). View details.
Updated at 11:30am July 30
BART ridership for Wednesday, July 29 was 45,918, representing an 89% drop compared to July budget projections. Ridership for the Milpitas and Berryessa stations was 343 exits.
Updated at 10:45am July 29
BART ridership for Tuesday, July 28 was 45,085, representing an 89% drop compared to July budget projections. Ridership for the Milpitas and Berryessa stations was 345 exits.
BART partners with the Latino Task Force on COVID-19 and UCSF for testing at 24th St. Mission plaza
BART is teaming up with UC San Francisco infectious disease specialists and community partners in San Francisco's Mission district to enhance the ability of public health officials to detect and contain the spread of coronavirus among the heavily impacted Latinx community and essential workers. It is believed to be a first-in-the-nation pilot program to provide low-barrier COVID-19 testing — free, simple, and convenient — at a central transit hub.
The pilot testing initiative will occur at the central 24th St. and Mission Plaza transit hub on Wednesdays and Fridays for three weeks, beginning on July 29. Testing will be available during convenient hours for workers: from 7 am to 6 pm. The testing program will include simple on-site registration and PCR-based testing, with the option for participants to self-administer the tests or have them administered by a laboratory technician. The initiative will include a fast-track lane for people who work at local Mission businesses as well as BART employees.
Updated at 9am July 28
BART ridership for Monday, July 27 was 43,318, representing an 89% drop compared to July budget projections. Ridership for the Milpitas and Berryessa stations was 377 exits.
Updated at 11am July 27
BART ridership for Sunday, July 26 was 17,185, representing an 84% drop compared to July budget projections. Ridership for the Milpitas and Berryessa stations was 281 exits.
BART ridership for Saturday, July 25 was 22,791, representing an 86% drop compared to July budget projections. Ridership for the Milpitas and Berryessa stations was 337 exits.
BART ridership for Friday, July 24 was 44,300, representing an 89% drop compared to July budget projections. Ridership for the Milpitas and Berryessa stations was 405 exits.
View our passenger loading data showing the expected average number of people on board each car on specific trains for the week of July 27th-July 31st at www.bart.gov/crowding.
Updated at 9:20am July 24
BART ridership for Thursday, July 23 was 45,847, representing an 89% drop compared to July budget projections. Ridership for the Milpitas and Berryessa stations was 348 exits.
Updated at 8:45am July 23
BART ridership for Wednesday, July 22 was 45,712, representing an 89% drop compared to July budget projections. Ridership for the Milpitas and Berryessa stations was 372 exits.
The BART Board of Directors meets at 9am. View the COVID-19 update to be presented. Watch the board meeting: https://www.bart.gov/about/bod/multimedia
Updated at 1:45pm July 22
BART ridership for Tuesday, July 21 was 45,290, representing an 89% drop compared to July budget projections. Ridership for the Milpitas and Berryessa stations was 344 exits.
Tomorrow The BART Board of Directors meets at 9am. View the COVID-19 update to be presented. Watch the board meeting: https://www.bart.gov/about/bod/multimedia
Noteworthy updates include:
Transition to Contactless Payments
- Fares: All BART stations to vend only Clipper fare media by the end of 2020 (view the station roll out scheudle in the presentation linked above)
- Parking: BART Official app now provides parking payment option at all stations
- Clipper reduces the number of customer touch-points on BART
- Clipper allows for contactless payments
- Customers can load funds online in advance or get autoload
- Clipper cards are less prone to jamming faregates
- Clipper cards can be read through glass; station agents can maintain social distance while effectively assisting BART riders
Technology Evalutions
- Filter Testing
- MERV 14 filter is most promising option
- Results in 64% pressure drop for air supply
- Test MERV 14 filters in five cars, pilot test expected in early August for one maintenance cycle (3 months)
- UV Disinfecting
- Testing confirmed UV in HVAC duct work as best UV option
- UV Lights have been ordered for pilot project – expected in early August
- Possible field-testing scheduled to begin in August
- Demonstration of Disinfection Robot for rail cars
- Rescheduled to September to accommodate new generation currently under testing
- Hospital grade sterilization using vaporized Hydrogen Peroxide
Updated at 9:15am July 21
BART ridership for Monday, July 20 was 42,089, representing an 90% drop compared to July budget projections. Ridership for the Milpitas and Berryessa stations was 363 exits.
Updated at 5:20pm July 20
BART ridership for Sunday, July 19 was 17,258, representing an 84% drop compared to July budget projections. Ridership for the Milpitas and Berryessa stations was 292 exits.
Today we posted passenger loading data to show the expected average number of people on board each car on specific trains for the week of July 20-July 24th. View the charts at www.bart.gov/crowding
Updated at 5:45am July 19
BART ridership for Saturday, July 18 was 22,612, representing an 86% drop compared to July budget projections. Ridership for the Milpitas and Berryessa stations was 358 exits.
Updated at 6:50am July 18
BART ridership for Friday, July 17 was 45,652, representing an 89% drop compared to July budget projections. Ridership for the Milpitas and Berryessa stations was 410 exits.
Updated at 7:10am July 17
BART ridership for Thursday, July 16 was 46,021, representing an 89% drop compared to July budget projections. Ridership for the Milpitas and Berryessa stations was 351 exits.
Updated at 10:12am July 16
BART ridership for Wednesday, July 15 was 46,456, representing an 89% drop compared to July budget projections. Ridership for the Milpitas and Berryessa stations was 397 exits.
Updated at 7:50am July 15
BART ridership for Tuesday, July 14th was 46,264, representing an 89% drop compared to July budget projections. Ridership for the Milpitas and Berryessa stations was 372 exits.
Updated at 8:45pm July 14
Today, General Manager Bob Powers participated in a national media event with transit leaders throughout the country to advocate for additional funding.
Watch the press conference: https://www.youtube.com/watch?v=NGXIXptWiGg&feature=youtu.be
This letter was sent to Senate Leadership requesting $32-36 billion in additional funding for the public transportation industry to cover
COVID-related costs and revenue losses through 2021. Statewide, the California Transit Association says local public transit agencies need $3.1 Billion in emergency funding to prevent devastating permanent cuts that would cause many underserved communities to suffer disproportionate economic and social impacts. At BART, we project the pandemic and resulting economic recession will cut our revenue by $975 Million in the next 3 years (through FY22).
BART ridership for Monday, July 13th was 45,336 representing an 89% drop when compared to July budget projections. Ridership for the Milpitas and Berryessa stations was 374 exits.
BART ridership for Sunday, July 12th was 17,777 representing an 84% drop when compated to July budget projections. Ridership for the Milpitas and Berryessa stations was 344 exits.
View our passenger loading data showing the expected average number of people on board each car on specific trains for the week of July 13th-July 17th at www.bart.gov/crowding.
Updated at 5:50pm July 12
BART ridership for Saturday, July 11th was 23,874 representing an 85% drop when compared to July budget projections. Milpitas and Berryessa stations had a ridership of 408.
BART ridership for Friday, July 10th was 45,972 representing an 89% drop when compared to July budget projections. Milpitas and Berryessa stations had a ridership of 406.
Updated at 9:10am July 10
BART ridership for Thursday, July 9th was 46,946 representing an 89% drop when compared to July budget projections. Milpitas and Berryessa stations had a ridership of 333.
Updated at 9:10am July 9
BART ridership for Wednesday, July 8th was 47,231 representing an 89% drop when compared to July budget projections. Wednesday’s ridership total was the highest number for BART since March 18th. Milpitas and Berryessa stations had a ridership of 358.
Updated at 1:10pm July 8
BART ridership for Tuesday, July 7th was 47,220 representing an 89% drop when compared to July budget projections. Tuesday’s ridership total was the highest number for BART since March 18th. Milpitas and Berryessa stations had a ridership of 363.
The Metropolitan Transportation Commission today approved providing BART with $125.4 million in federal CARES Act FTA funding. This second allocation comes after the MTC in April provided BART with a first installment of $251.6 million. This latest action brings BART’s total share of CARES Act support to just over $377 million. The federal recovery bill dedicates $1.3 billion in funding for all Bay Area transit operators in response to the COVID-19 pandemic.
“We are grateful to Speaker of the House Nancy Pelosi and our Bay Area congressional delegation for prioritizing transit and the Metropolitan Transportation Commission for their leadership,” said BART General Manager Bob Powers. “This federal support is vital as BART continues to keep service running for essential workers and a growing number of riders who are returning to their jobs. It’s critical that BART remain poised to ramp up service as ridership gradually increases so we can support the Bay Area’s economic recovery.”
After falling to as low as 6% of regular ridership in April, the number of people taking BART has started to rise. Weekday ridership in July has hovered at about 11% of typical train loads for this month.
Updated at 9:00am July 7
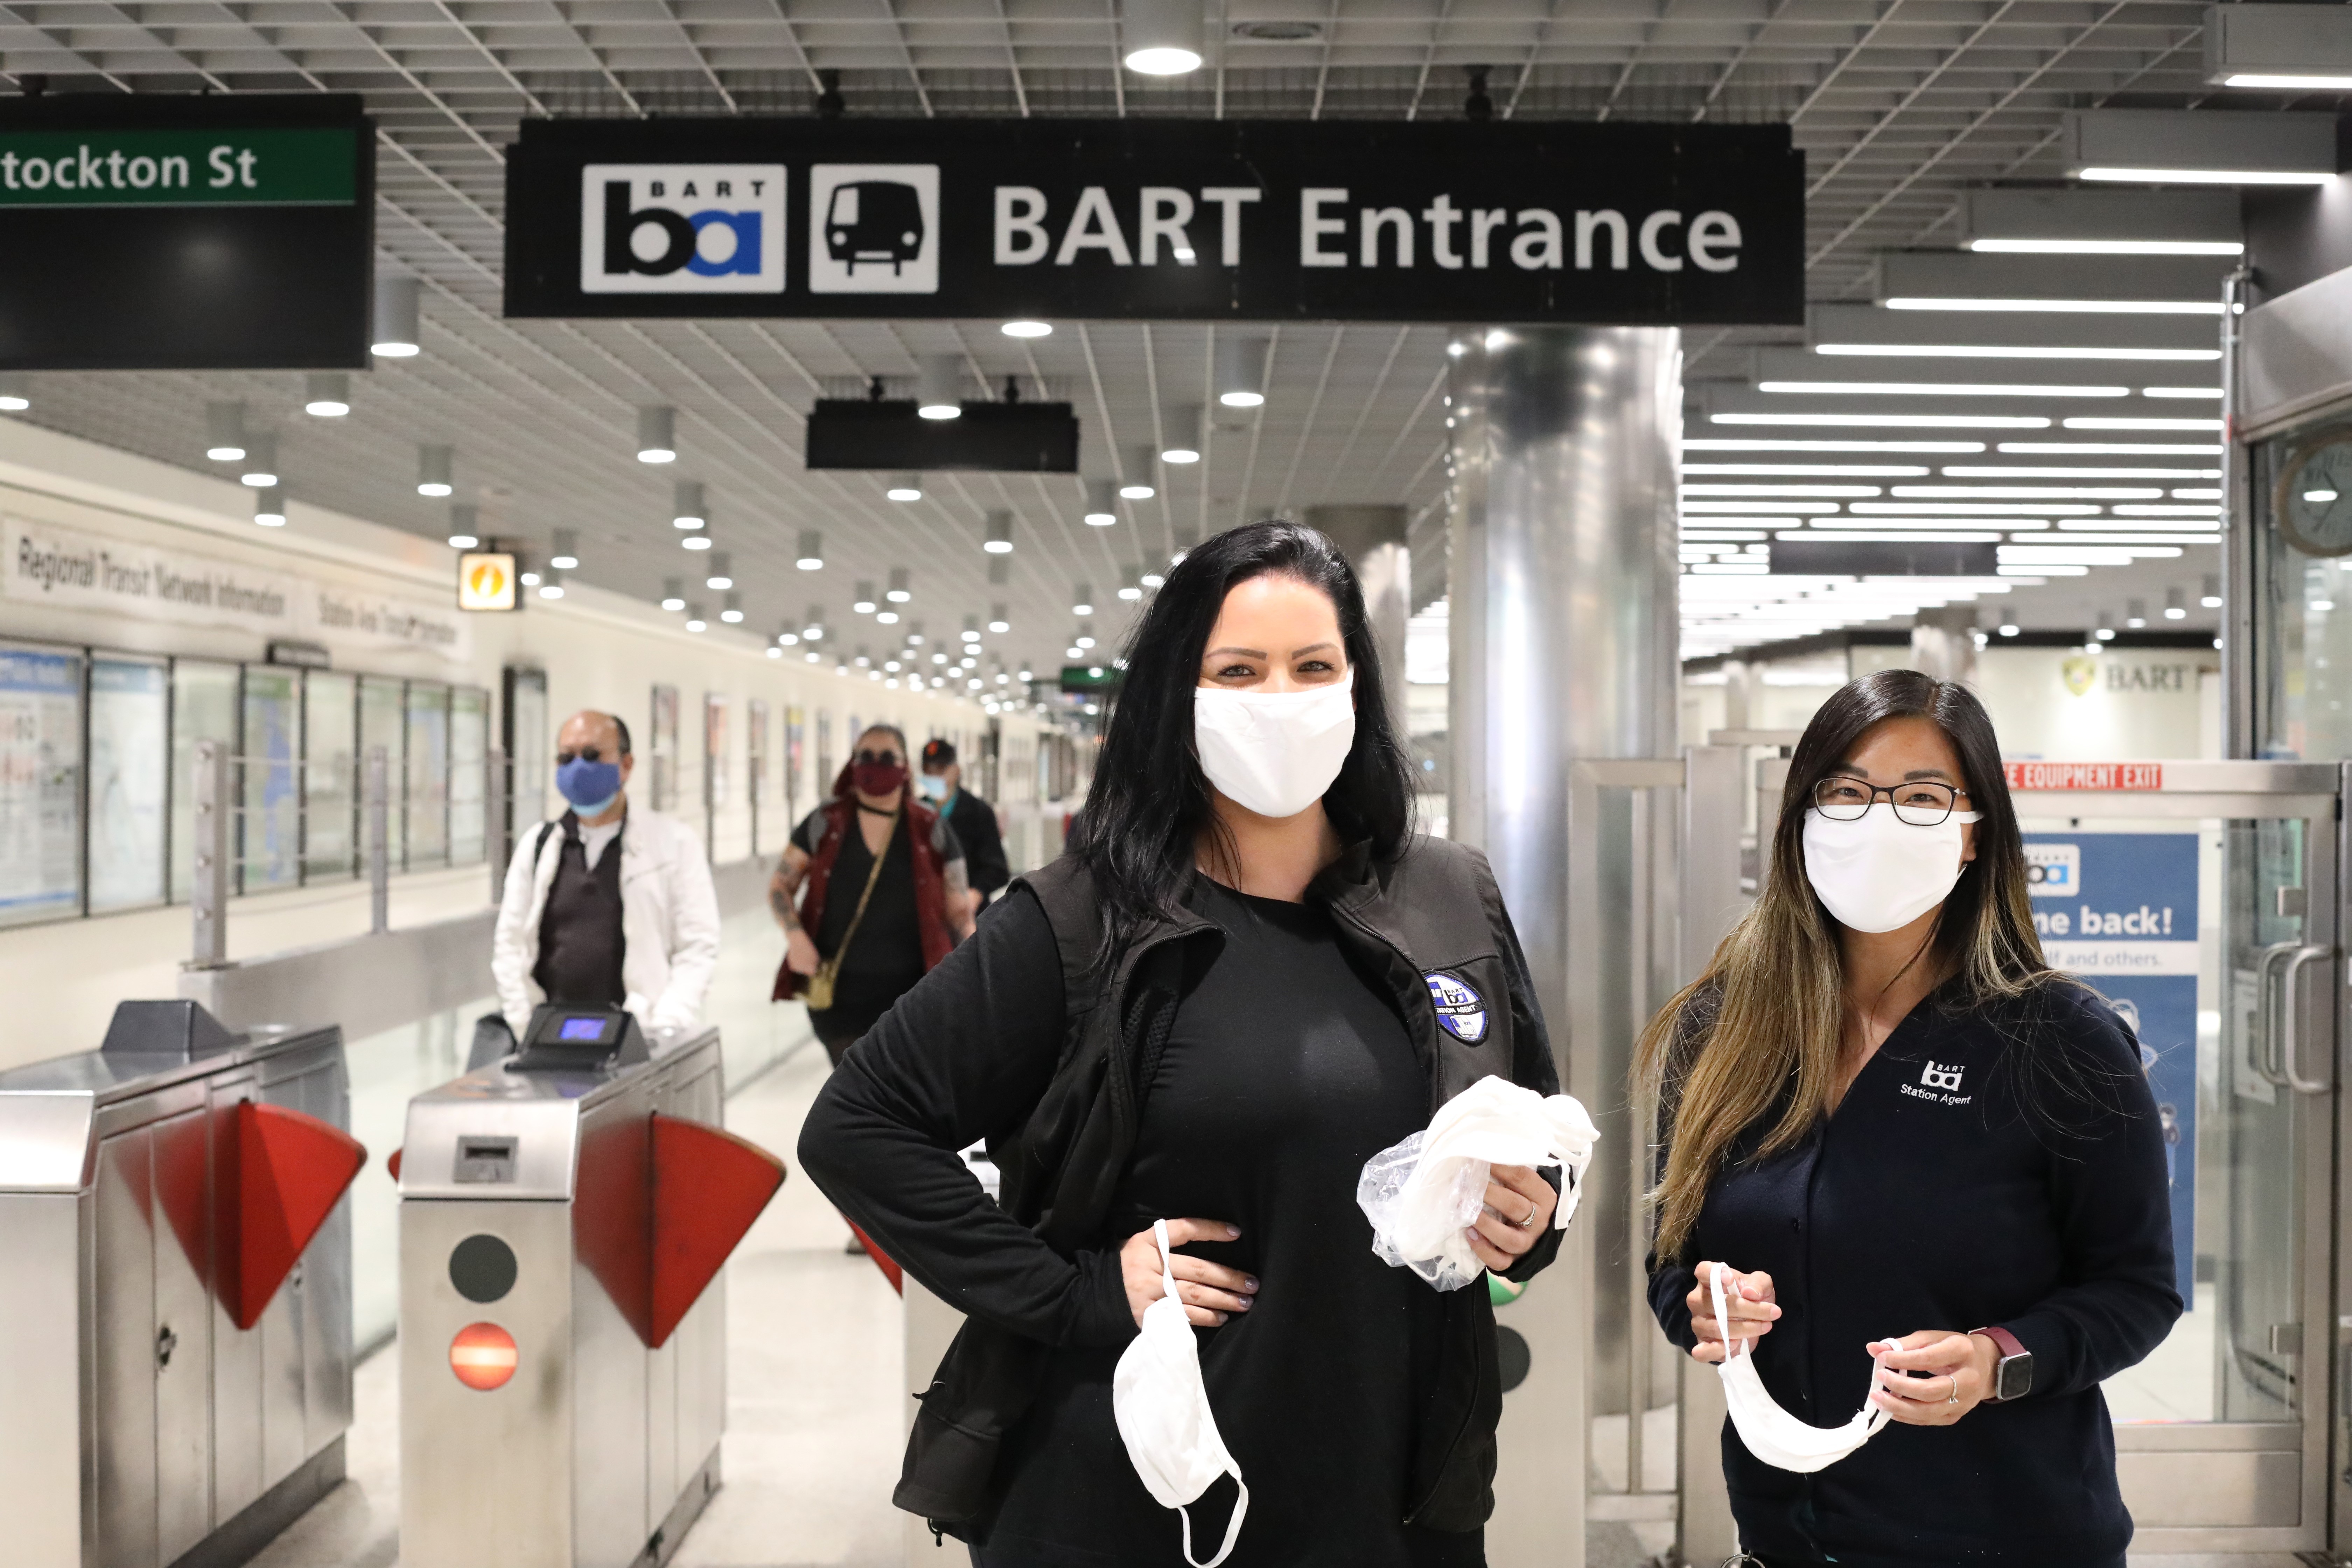
BART ridership for Monday July 6 was 43,928 representing a 89% drop when compared to July budget projections. Milpitas and Berryessa stations had a ridership of 371 exits.
Since launching the 15 Step Welcome Back Plan BART has made significant progress implementing the commitments we made:
- All stations now have extra masks available by request at the station agent booths for those who need one.
- We launched crowding data charts.
- We launched an online store to purchase personal hand straps.
- We launched contactless parking payment systemwide.
- All stations have decals, posters and banners posted outlining new safety protocols and identifying locations of hand sanitizer in each station.
- We now have enough disinfecting foggers to spray every car in service every 24 hours (an increase from every 72 hours).
- We’ve increased train frequency on our busiest line.
- Our new seat configuration on board one car is complete and is in service.
- We are assessing HEPA and MERV 14 filters for cars and testing UV in HVAC duct work.
- We’ve held virtual townhalls with more than 120 companies that have office space near BART stations.
- We’ve translated the Welcome Back Plan into Chinese, Spanish, Korean, Tagalog, Vietnamese.
Updated at 8:30am July 6
BART ridership for Sunday July 5 was 17,169 representing a 84% drop when compared to July budget projections. Milpitas and Berryessa stations had a ridership of 288 exits.
BART ridership for Saturday July 4 was 18,568 representing a 86% drop when compared to July 4th holiday budget projections. Ridership for Milpitas and Berryessa was 319
BART ridership for Friday July 3 was 32,725 representing a 92% drop when compared to July budget projections. Ridership for Milpitas and Berryessa was 417.
BART ridership for Thursday July 2 was 46,450 representing an 89% drop when compared to July budget projections. Milpitas and Berryessa had a ridership of 368 exits.
The latest crowding charts have been posted at www.bart.gov/crowding as well as here:
Crowding Charts for Week of July 6 - July 10
Antioch_to_SFO__Millbrae_7_6 to 7_10.pdf
SFO__Millbrae__to_Antioch 7_6 to 7_10.pdf
Berryessa-North_San_José_to_Daly_City 7_6 to 7_10.pdf
Daly_City_to_Berryessa-North_San_José 7_6 to 7_10.pdf
Berryessa-North_San_José_to_Richmond 7_6 to 7_10.pdf
Richmond_to_Berryessa-North_San_José 7_6 to 7_10.pdf
Daly_City_to_Dublin-Pleasanton 7_6 to 7_10.pdf
Dublin-Pleasanton_to_Daly_City 7_6 to 7_10.pdf
Millbrae_to_Richmond 7_6 to 7_10.pdf
Richmond_to_Millbrae 7_6 to 7_10.pdf
Updated at 9:20am July 2
BART ridership for Wednesday July 1 was 47,183 representing a 89% drop when compared to July budget projections. Milpitas and Berryessa stations had a ridership of 374 exits.
47,183 is the highest ridership to date since ridership bottomed out in April at around 23,000.
BART has been awarded a grant from Smart Growth America to participate in the Arts & Transportation Rapid Response initiative. Out of almost 200 applications, BART's proposal was one of five selected. The projects selected seeks to address COVID-related transportation challenges and systemic inequities and do so in unique, creative ways, with the support of local artists.
The following outlines our project:
Nationwide, wearing masks to curb the spread of COVID-19 has unleashed serious issues and concerns for people of color, specifically Black, Latinx, and Asian people due to racially-motivated harassment and violence. San Francisco Bay Area Rapid Transit (BART) recognizes that facial coverings may attach an additional stigma to people who already experience discrimination and is committed to ensuring transit is safe and as welcoming as possible for all riders. BART will collaborate with an artist to pilot a community-informed intervention strategy to deconstruct racial prejudices worsened by COVID-19, and normalize the culture of mask wearing on transit.
Updated at 4:15pm July 1
BART ridership for Tuesday June 30 was 45,628 representing a 89% drop when compared to June budget projections. Milpitas and Berryessa stations had a ridership of 354 exits.
Today we launched our online merchandise store www.railgoods.com.
We quickly worked to launch the online store to make available for purchase personal hand straps that can be used while standing on any train and taken home to disinfect. They cost $5 plus tax and shipping. We are charging the price it cost BART to purchase the straps with no mark up.
Updated at 1:20pm June 30
BART ridership for Monday June 29 was 43,861 representing a 89% drop when compared to June budget projections. Milpitas and Berryessa stations had a ridership of 343 exits.
Today BART is launching weekly train car loading charts to provide a snapshot at what riders can expect on-board trains during the COVID-19 pandemic. The commitment to share this data is part of BART’s 15-Step Welcome Back Plan as the region reopens. The schedule-based passenger load data outlines the average number of riders on each car of a specific train. The charts will be shared weekly at www.bart.gov/crowding and on social media to give riders a tool to plan their return to work and have greater confidence that they're doing so in as safe a manner as possible. Read the full announcement and details about the data at https://www.bart.gov/news/articles/2020/news20200624
Updated at 9:30am June 29
BART ridership for Sunday June 28 was 17,640 representing a 85% drop when compared to June budget projections. Milpitas and Berryessa stations had a ridership of 364 exits.
BART ridership for Saturday June 27 was 22,997 representing a 85% drop when compared to June budget projections. Ridership for Milpitas and Berryessa was 385.
BART ridership for Friday June 26 was 45,002 representing a 89% drop when compared to June budget projections. Ridership for Milpitas and Berryessa was 401.
Updated at 8:55am June 26
BART ridership for Thursday June 25 was 45,045 representing an 89% drop when compared to June budget projections. Milpitas and Berryessa had a ridership of 339 exits.
Updated at 8:15am June 25
BART ridership for Wednesday June 24 was 45,321 representing a 89% drop when compared to June budget projections. Milpitas and Berryessa stations had a ridership of 372 exits.
The BART Board of Directors meets today at 9am. View the COVID-19 update to be presented. Watch the board meeting: https://www.bart.gov/about/bod/multimedia
Updated at 9am June 24
BART ridership for Tuesday June 23 was 45,289 representing a 89% drop when compared to June budget projections. Milpitas and Berryessa stations had a ridership of 327 exits.
Updated at 9am June 23
BART ridership for Monday June 22 was 43,671 representing a 89% drop when compared to June budget projections. Milpitas and Berryessa stations had a ridership of 357 exits.
The BART Board of Directors will meet on Thursday. View the COVID-19 update to be presented.
The presentation includes the results of a post COVID-19 Rider Survey. The survey occured in May via an email invitation to a random sample of 5,000 BART riders (people who were riding BART pre-COVID).
Survey highlights include:
- 15% of riders surveyed are currently riding BART
- A total of 70% of those currently not riding, indicated that they are very or somewhat likely to ride within the next 12 months
- Among the 70% who say they are very or somewhat likely to return to BART in the next 12 months, about 2/3 may come back in the near term
Updated at 11:20am June 22
BART ridership for Sunday June 21 was 16,413 representing a 86% drop when compared to June budget projections. Milpitas and Berryessa stations had a ridership of 388 exits.
Beginning today, BART is extending its 3 extra commute trains on the Yellow Line from Pleasant Hill to/from Daly City to Pittsburg/Bay Point to/from Daly City, as recent ridership data showed the need to extend the train service.
On June 8, BART added 3 trains on the Yellow Line -- its current busiest line -- at its busiest hours. Since June 8, BART ran 3 added trains originating at Pleasant Hill at 6:16am, 6:46am, 7:16am, creating a 15 minute frequency from 5:30am to 7am; in the afternoon, BART ran 3 added trains originating at Daly City at 3:55 pm, 4:15 pm and 4:45 pm, creating a 15-minute frequency between 3:30pm and 5pm.
Starting June 22, the 3 added trains will begin at Pittsburg/Bay Point at 6:01am, 6:31am and 7:01am in the Daly City direction. In the afternoon, the 3 added trains will begin at Daly City at 3:55pm, 4:25pm, and 4:55pm in the Pittsburg/Bay Point direction. The revised schedule still will create a 15-minute frequency between 5:30am and 7am and 3:30pm and 5pm, respectively.
Click here for a printable PDF of the new Antioch to SFO line schedule with added trains.
Updated at 2:45pm June 21
BART ridership for Saturday June 20 was 22,908 representing a 85% drop when compared to June budget projections. Ridership for Milpitas and Berryessa was 477.
BART ridership for Friday June 19 was 47,163 representing a 88% drop when compared to June budget projections. Ridership for Milpitas and Berryessa was 457.
Updated at 1pm June 19
BART ridership for Thursday June 18 was 44,528 representing a 89% drop when compared to June budget projections. Ridership for Milpitas and Berryessa was 392 exits.
Updated at 9:30am June 18
BART ridership for Wednesday June 17 was 44,268 representing a 89% drop when compared to June budget projections. Ridership for Milpitas and Berryessa was 395 exits.
Updated at 7:45am June 17
BART ridership for Tuesday June 16 was 43,515 representing a 89% drop when compared to June budget projections. Ridership for Milpitas and Berryessa was 390 exits.
Updated at 9:30am June 16
BART ridership for Monday June 15 was 41,832 representing a 90% drop when compared to June budget projections. Ridership for Milpitas and Berryessa was 361 exits.
Updated at 9am June 15
BART ridership for Sunday June 14 was 15,364 representing a 87% drop when compared to June budget projections. Milpitas and Berryessa stations had a ridership of 501 exits.
BART ridership for Saturday June 13 was 21,186 representing a 86% drop when compared to June budget projections. This was the first day of service to Milpitas and Berryessa. The two new stations had a ridership of 977 exits.
BART ridership for Friday June 12 was 39,177 representing a 90% drop when compared to June budget projections.
BART ridership for Thursday June 11 was 39,676 representing a 90% drop when compared to June budget projections.
Updated at 8:20am June 11
BART ridership for Wednesday June 10 was 39,235 representing a 90% drop when compared to June budget projections.
Today the BART Board of Directors will meet virtually at 9am. Read the COVID-19 update presentation. Watch the board meeting: https://www.bart.gov/about/bod/multimedia
Part of BART's 15 Step Welcome Back Plan is to explore new technologies. Today the Board will get the following update:
Test new style electrostatic fogging application – Complete
- Successful – Now disinfecting operating fleet nightly
- 24 additional electrostatic fogging applicators on order
Demonstration of Static UV process to disinfect train interiors – Complete
- Unsuccessful
- Extremely Labor Intensive – three people to set up and operate
- Inefficient – 20 minutes application time per car (plus additional set up time)
Assessing HEPA and MERV 14 filters for Legacy and FOTF cars – In progress
- Prototype Testing to begin June 10
Testing UV in HVAC duct work for Legacy and FOTF Cars – In progress
- Design in progress
- Possible field-testing late July
Demonstration of Disinfection Robot for rail cars – Week of June 15
Researching permanently mounted pulse UV technology in rail cars – In progress
Updated 9am June 10
BART ridership for Tuesday June 9 was 38,406 representing a 90% drop when compared to June budget projections.
Tomorrow the BART Board of Directors will meet virtually at 9am. Read the COVID-19 update presentation. Watch the board meeting: https://www.bart.gov/about/bod/multimedia
Updated at 9:35am June 9
BART ridership for Monday June 8 was 37,361 representing a 91% drop when compared to June budget projections.
BART learned this afternoon that an employee in a role that interacts with the public has tested positive for COVID-19. The employee wore a mask and gloves and socially distanced themselves during their shifts prior to the test and is now in quarantine. The last day the employee worked in the public was Sunday. Our contact tracing shows the employee had no close contact with the public, however spent time in stations and on trains throughout the system. All identified employee contacts have been quarantined for testing.
All BART cars in service are fogged with disinfectant every 24 hours. Touchpoints on cars are wiped down with disinfectant at the end of each run. Stations are cleaned multiple times each day with touchpoints wiped down at least six times per janitor shift.
This is the first instance of a front-line employee testing positive for COVID-19. Two employees in “behind the scene” roles who tested positive in the past weeks were quarantined and contact tracing was negative. Both employees have recovered.
BART is complying with Health Insurance Portability and Accountability Act (HIPAA) privacy requirements regarding the sensitive health information of our employees who have tested positive.
Updated at 8:50am June 8
BART ridership for Sunday June 7 was 13,339 representing a 89% drop when compared to June budget projections. (There was a planned track closure with bus bridge on June 7)
Updated at 2:35pm June 7
BART ridership for Saturday June 6 was 18,021 representing a 88% drop when compared to June budget projections. (There was a planned track closure with bus bridge on June 6)
BART ridership for Friday June 5 was 35,404 representing a 91% drop when compared to June budget projections.
Update at 3:30PM June 5
BART ridership for Thursday June 4 was 34,725 representing a 91% drop when compared to June budget projections.
Beginning Monday, June 8, BART will add 3 trains to the morning and afternoon commute on the Yellow Line between Pleasant Hill to Daly City. In the morning, the 3 added trains will originate at Pleasant Hill at 6:16am, 6:46am, 7:16am, create a 15 minute frequency from 6am to 7:30am on our busiest line. In the afternoon, the 3 added trains will originate at Daly City at 3:55 pm, 4:15 pm and 4:45 pm, creating a 15-minute frequency between 4pm and 5pm.
For morning commuters looking to take advantage of the extra service, there is plenty of parking at Pleasant Hill in the early morning hours.
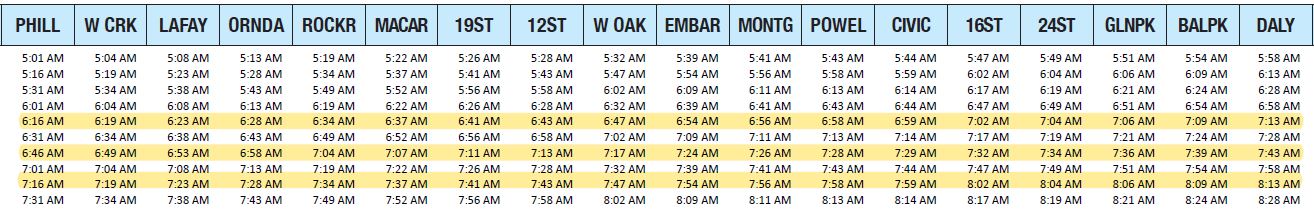
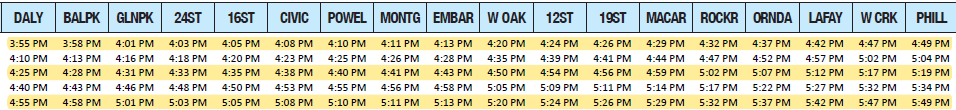
Click here for a printable PDF of the new Antioch to SFO line schedule with added trains.
Updated at 9:10am June 4
BART ridership for Wednesday June 3 was 37,911 representing a 91% drop when compared to June budget projections.
As outlined in our 15 Step Welcome Back Plan, as riders begin to trickle back, BART is committed to adding trains to increase frequency and help maintain social distancing. Last week we added 2 trains on the Antioch line (one in the morning commute and one in the afternoon commute) to make for 15-minute frequency and next week we plan to add 2 more trains in the morning. We are finalizing the exact time slots and will post the new schedule soon.
Updated at 9am June 3
BART ridership for Tuesday June 2 was 32,142 representing a 92% drop when compared to June budget projections. A variety of curfews were in place in areas we serve on June 2nd however BART maintained the published schedule for essential workers and did not suspend service.
Updated at 8:5am June 2
BART ridership for Monday June 1 was 32,142 representing a 92% drop when compared to June budget projections. A variety of curfews were in place in areas we serve on June 1st however BART maintained the published schedule for essential workers and did not suspend service.
Updated at 9am June 1
BART ridership for Sunday May 31 was 11,924 representing a 88% drop when compared to May budget projections.
BART ridership for Saturday May 30 was 15,568 representing a 89% drop when compared to May budget projections.
BART ridership for Friday May 29 was 34,152 representing a 92% drop when compared to May budget projections.
Updated at 2pm May 29
BART ridership for Thursday May 28 was 33,681 representing a 92% drop when compared to May budget projections for ridership.
Updated at 8:15am May 28
BART ridership for Wednesday May 27 was 33,004 representing a 92% drop when compared to May budget projections for ridership. Wednesday's ridership had 8,799 more riders than one month ago (compared to Wednesday April 22 at 24,205).
Today the BART Board of Directors will meet virtually at 9am. Read the COVID-19 update presentation. Read the budget presentation. Read the detailed Working Budget Memo. Watch the board meeting: https://www.bart.gov/about/bod/multimedia
Updated at 10:45am May 27
BART ridership for Tuesday May 26 was 32,527 representing a 92% drop when compared to May budget projections.
Today BART released a 15 Step Plan to welcome riders back as the region begins to reopen. The plan outlines cleaning measures, safety protocols, and details on what riders can expect. Read the plan and watch the train fogging video.
Updated at 9:20am May 26
BART ridership for Monday May 25 (Memorial Day Holiday) was 13,133 representing a 86% drop when compared to May budget projections for holiday ridership.
Updated at 4:40pm May 25
BART ridership for Sunday May 24 was 11,720 representing a 89% drop when compared to May budget projections.
BART ridership for Saturday May 23 was 15,186 representing a 89% drop when compared to May budget projections.
BART ridership for Friday May 22 was 31,376 representing a 92% drop when compared to May budget projections.
Updated at 9:20am May 22
BART ridership for Thursday May 21 was 31,384 representing a 92% drop when compared to May budget projections.
Updated at 12:30pm May 21
BART ridership for Wednesday May 20 was 31,271 representing a 92% drop when compared to May budget projections.
Updated at 10:45am May 20
BART ridership for Tuesday May 19 was 30,978 representing a 92% drop when compared to May budget projections.
Updated at 4pm May 19
BART ridership for Monday May 18 was 29,555 representing a 93% drop when compared to May budget projections.
Updated at 9:10am May 18
BART ridership for Sunday May 17 was 9,980 representing a 90% drop when compared to May budget projections.
Updated at 9:10am May 17
BART ridership for Saturday May 16 was 14,484 representing a 90% drop when compared to May budget projections.
BART ridership for Friday May 15 was 30,170 representing a 93% drop when compared to May budget projections.
Updated at 10:10am May 15
BART ridership for Thursday May 14 was 28,966 representing a 93% drop when compared to May budget projections.
Updated at 8:20am May 14
BART ridership for Wednesday May 13 was 29,119 representing a 93% drop when compared to May budget projections.
The BART Board of Directors meets today at 9am. View the COVID-19 presentation and the budget presentation which provides an overview on ridership modeling and COVID-19 response measures being evaluated by BART.
Watch the meeting live or archived at https://www.bart.gov/about/bod/multimedia
Updated at 1:20pm May 13
BART ridership for Tuesday May 12 was 28,173 representing a 93% drop when compared to May budget projections.
The BART Board of Directors will meet tomorrow. View the COVID-19 presentation and the budget presentation which provides an overview on ridership modeling and COVID-19 response measures being evaluated by BART.
Updated at 12:45pm May 12
BART ridership for Monday May 11 was 27,408 representing a 93% drop when compared to May budget projections.
This morning, BART General Manager Bob Powers joined a press conference with a national coalition of a number of the country’s largest public transportation agencies along with national transportation labor leaders to ask Congress to include at least $32 billion in transit funding in its next COVID-19 response package. BART is facing about $600 million in budget deficit when combining this current fiscal year and next fiscal year. Powers noted:
"For the economy to recover, BART and public transit in general must be there. We can’t afford to be reactive. We must be up and fully functioning to deliver. We must keep employees healthy and safe, operate a thoroughly clean and disinfected system and put out frequent service. BART and public transportation must be the first choice to avoid gridlock that would slow economic recovery. We’ve made great strides to get folks out of cars and into transit. We can’t trigger deep cuts to unravel our ability to move people."
Watch the press conference at https://www.youtube.com/watch?v=WmgAff1S5Ps&feature=youtu.be
Powers' statement begins at 13:24 mark. He also answers questions from Bay Area and national media later in the call.
Updated at 10:30am May 11
BART ridership for Sunday May 10 was 10,221 representing a 90% drop when compared to May budget projections.
Updated at 7:30am May 10
BART ridership for Friday May 8 was 28,220 representing a 93% drop when compared to May budget projections. Friday May 1 had 1,146 more exits compared to the previous Friday (5/1) and 3,690 more exits when compared to 2 weeks ago (4/24).
BART ridership for Saturday May 9 (during a major track closure) was 13,679 representing a 90% drop when compared to May budget projections. Saturday May 2 had 516 more exits compared to the previous Saturday (5/2) when there wasn't a track closure, and 1,784 more exits when compared to 2 weeks ago (4/25).
Updated at 9:20am May 8
BART ridership for Thursday May 7 was 28,113 representing a 93% drop when compared to May budget projections. Thursday May 7 had 2,426 more exits compared to the previous Thursday (4/30).
Updated at 9:15am May 7
BART ridership for Wednesday May 6 was 27,768 representing a 93% drop when compared to May budget projections. Wed May 6 had 2,466 more exits compared to the previous Wednesday (4/29).
BART General Manager Bob Powers joined transit systems across the country and sent a letter to Congressional leaders yesterday requesting urgent assistance in providing aid to public transportation agencies in the next COVID-19 relief bill.
The letter reads in part:
"And though the full impact of the coronavirus pandemic is not yet fully known, the San Francisco Bay Area expects to have $1.3 billion in lost revenues through 2021 not covered by the CARES Act, NY MTA forecasts an additional $8.9 billion, and Sound Transit projects an additional $628.6 million for the same period....
For public transportation agencies, a fuller picture has now emerged of the depth and breadth of COVID-19-fueled revenue losses from dedicated transportation revenue streams, such as farebox, sales taxes, motor fuel taxes, tolls, mortgage-related taxes and other user fees. All funding sources, including those from our supporting localities, that our systems rely upon are taking massive hits as a result of COVID-19, shelter-in-place orders, and the general economic downturn. Our systems will not be able to support the regions we serve without replenishing those losses. Our regions cannot recover without public transportation, and the nation cannot recover without resurgent economies in our regions.
Revenue replenishment is our most immediate need in combination with substantial investment in transportation infrastructure to facilitate community recovery while maintaining employment."
Updated at 9:10am May 6
BART ridership for Tuesday May 5 was 27,562 representing a 93% drop when compared to May budget projections. Tuesday May 5 had 2,555 more exits compared to the previous Tuesday (4/28).
Updated at 9:30am May 5
BART ridership for Monday May 4 was 27,070 representing a 93% drop when compared to May budget projections. Monday May 4 had 2,861 more exits compared to the previous Monday (4/27).
BART General Manager Bob Powers will participate in the Bay Area Council's webinar, "Bay Area Impact: COVID-19 Webinar, Transportation Chiefs Edition" on Thursday, May 7th at 11am-Noon. You can register for the event here.
Updated at 9:30am May 4 (updated at 2:30pm to reflect May baseline budget projections)
BART ridership for Friday May 1 was 27,074 representing a 93% drop when compared to May budget projections. Friday May 1 had 2,544 more exits compared to the previous Friday (4/24).
BART ridership for Saturday May 2 was 13,163 representing a 90% drop when compared to May budget projections. Saturday May 2 had 1,268 more exits compared to the previous Saturday (4/25).
BART ridership for Sunday May 3 was 9,963 representing a 90% drop when compared to May budget projections. Sunday May 3 had 1,200 more exits compared to the previous Sunday (4/26).
Updated at 11am May 1
BART ridership for Thursday April 30 was 25,687 representing a 94% drop when compared to April ridership budget projections.
Updated at 11am April 30
BART ridership for Wednesday April 29 was 25,302 representing a 94% drop when compared to April ridership budget projections.
Updated at 12:30pm April 29
BART ridership for Tuesday April 28 was 25,007 representing a 94% drop when compared to April ridership budget projections.
Updated at 5:15pm April 28
BART ridership for Monday April 27 was 24,209 representing a 94% drop when compared to April ridership budget projections.
Updated at 10:45am April 27
BART ridership for Sunday April 26 was 8,763 representing a 91% drop when compared to April ridership budget projections.
Updated at 2:45pm April 26
BART ridership for Friday April 24 was 24,530 representing a 94% drop when compared to April ridership budget projections.
BART ridership for Saturday April 25 was 11,895 representing a 92% drop when compared to April ridership budget projections.
Updated at 9:30am April 24
BART ridership for Thursday April 23 was 24,093 representing a 94% drop when compared to April ridership budget projections.
BART wants to thank Marcus Semien, shortstop for the Oakland A's and Bay Area native, for purchasing lunch for BART employees today. The Oakland A's reached out to BART earlier this week because Semien was interested in supporting essential workers by providing lunch from a local food caterer.
Updated at 9:45am April 23
BART ridership for Wednesday April 22 was 24,205 representing a 94% drop when compared to April ridership budget projections.
Updated at 3:15pm April 22
BART ridership for Tuesday April 21 was 23,277 representing a 94% drop when compared to April ridership budget projections.
Today the Metropolitan Transportation Commission approved providing BART with $251.6 million in federal CARES Act FTA funding. The allocation is the first installment of the $1.3 billion in funding provided to Bay Area transit operators in response to the COVID-19 pandemic. This money, coupled with cost cutting measures we immediately took, will help bridge our multi-million funding gap that was brought on in a matter of weeks by the pandemic. The money will also support BART labor forces, keeping employees safe, healthy, and employed. Read the press release.
BART General Manager Bob Powers sent this letter to the MTC in support of the Federal Cares Act funding allocation.
Tomorrow, Thursday, April 23, 2020 the BART Board of Directors will meet at 9am. View the COVID-19 update presentation. The public can watch the board meeting at live or archived at https://www.bart.gov/about/bod/multimedia
BART Communications also put out today a feature story about how we are taking unprecedented steps to increase the opportunities available to small businesses during the coronavirus outbreak. These efforts are helping to continue essential construction projects and keeping small business employees on the job and drawing a paycheck. Read the feature: https://www.bart.gov/news/articles/2020/news20200422
Updated at 11:45am April 21
BART ridership for Monday April 20 was 22,997 representing a 94% drop when compared to April ridership budget projections.
New face covering requirement for BART riders
County health orders in Alameda, Contra Costa, San Francisco, and San Mateo now require all riders to wear face coverings inside BART stations and on-board trains. The orders also require BART to take reasonable measures to remind the public that they need facing coverings and “must take all reasonable steps to prohibit any member of the public who is not wearing a face covering from entering and must not serve that person if those efforts are unsuccessful and seek to remove that person.” Failure to comply with the emergency health order is a misdemeanor. Enforcement begins Wednesday, April 22, 2020. Prior to the order, most BART riders were already wearing face coverings while riding. BART will take the following steps to be compliant with the new orders.
Public Communication
- Signs with pictograms will be posted in all stations stating: Face coverings required. Please keep 6 ft apart. Non-medical masks, bandanas, scarves, and cloth can be used.
- PA announcements inside stations and on-board trains
- Platform digital sign messages
- Website updates and social media posts
BART Police Deployment and Enforcement Strategies
BART Police Chief Ed Alvarez recently shifted deployment to focus police resources to the entrances of stations and near the faregates. This strategy was put into place to improve safety for our employees and riders and to prevent illegal behavior from occurring. Continuing this deployment will help BART enforce the new orders.
BART Police will be responsible for reminding riders of the new requirement. Consistent with BART’s current operating procedures, Station Agents will not be used to enforce the new public health emergency orders as they are not trained law enforcement personnel.
BART Police will give verbal reminders of the requirement to riders without face coverings when police encounter someone not covering their mouth and nose. Police personnel will remind the rider they have the option to use any material to cover their face. Only upon refusal to cover their face with any material will an officer ask the person to leave the system.
Riders should not confront others without a face covering. If someone isn’t wearing a face covering, riders should move away from the individual.
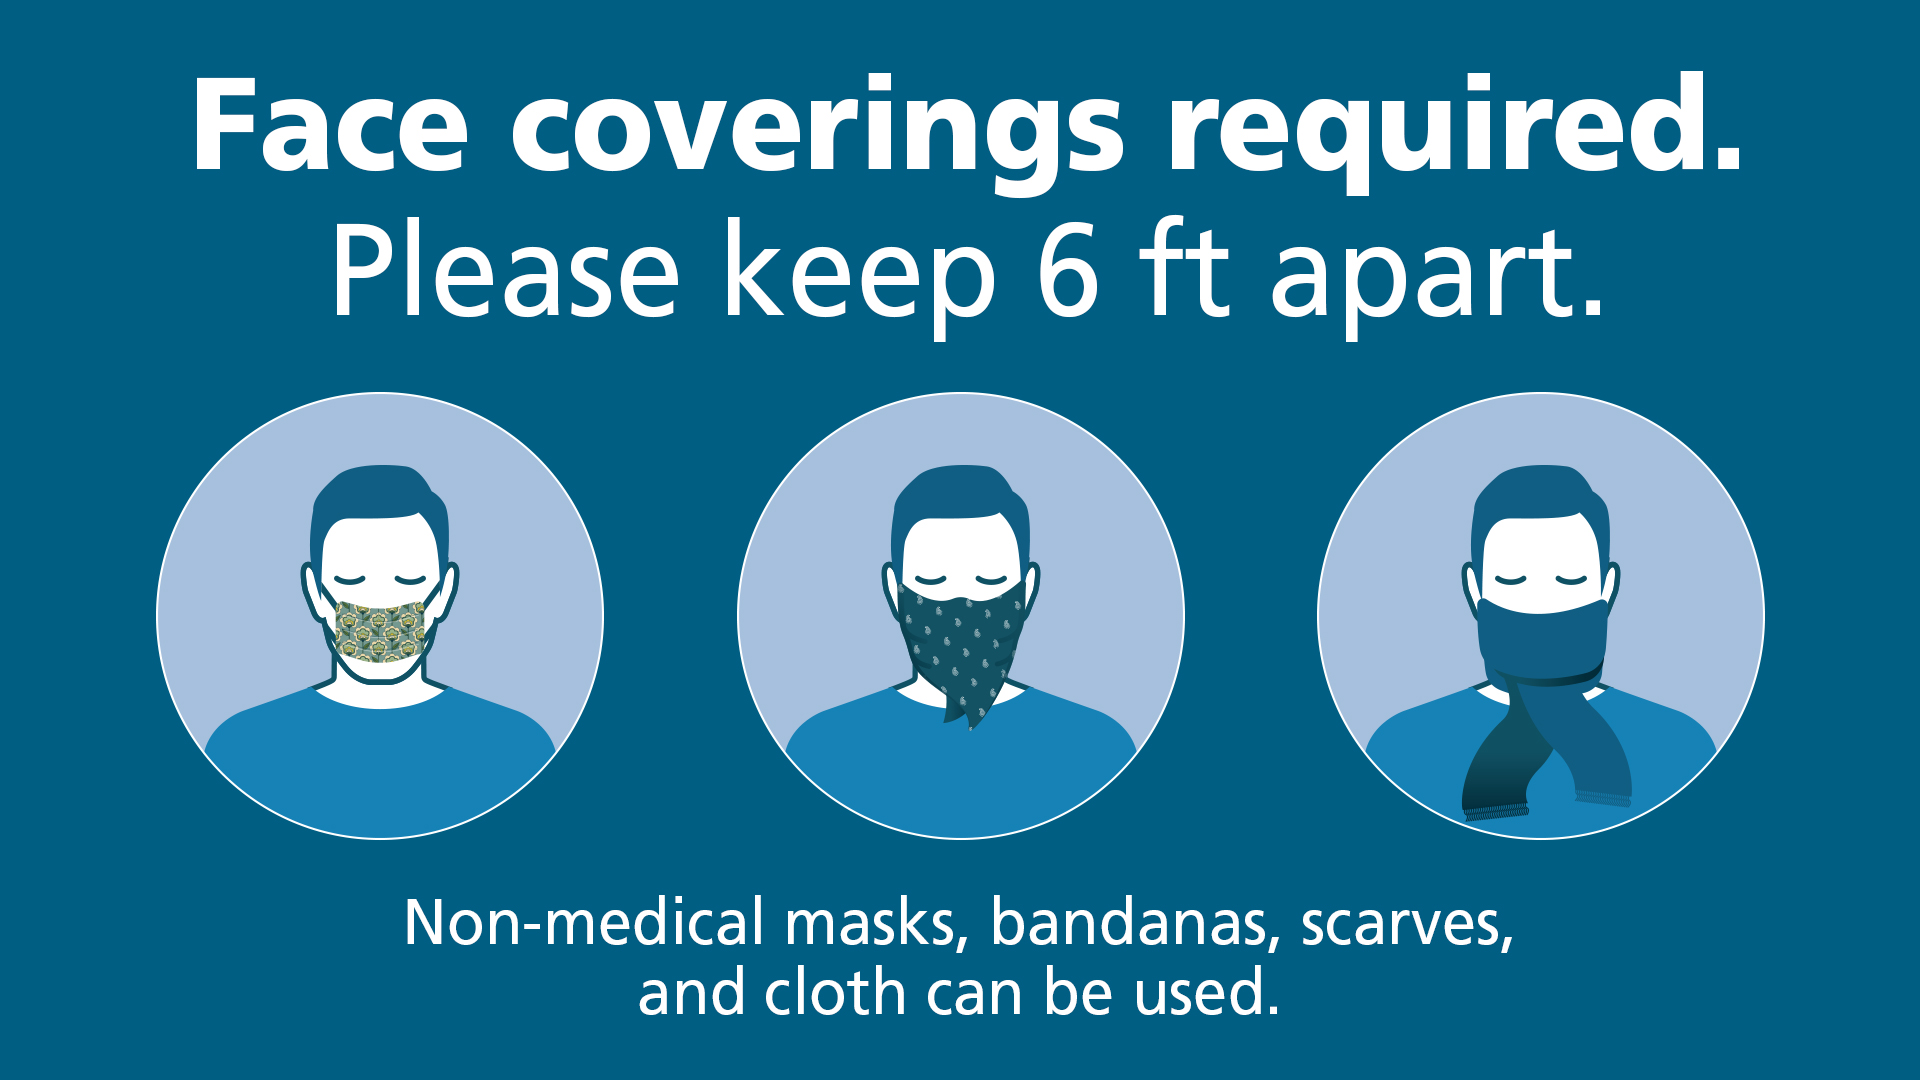
Updated at 9:30am April 20
BART ridership for Sunday April 19 was 8,205 representing a 91% drop when compared to April ridership budget projections.
The BART Board of Directors will meet on Thursday, April 23 at 9am. View the COVID-19 update presentation. The public can watch the board meeting at live or archived at https://www.bart.gov/about/bod/multimedia
Updated at 8:30am April 19
BART ridership for Saturday April 18 was 11,249 representing a 93% drop when compared to April ridership budget projections.
BART ridership for Friday April 17 was 24,006 representing a 94% drop when compared to April ridership budget projections.
Starting tomorrow (Monday, April 20) County Connection will stop running Early Bird Express routes 712 and 715 between Pittsburg Bay Point, Pleasant Hill and Downtown Oakland. Riders who use to take the 712 can now drive to Macarthur to catch the 705 or take the first SFO train at 5:01am or Antioch train at 5:41am. Riders who use to take the 715 can now drive to Pleasant Hill to catch the 702 or catch the first train at 5:07 am (N. Concord) or 4:56 (Concord).
All other Early Bird Express changes begin April 27. Read the full announcement.
"Cover Your Face" health order
Bay Area counties including San Francisco, Alameda and Contra Costa have issued a new “Cover Your Face” health order requiring anyone working at or visiting an essential business, including public transit, to wear face coverings to help reduce the spread of COVID-19. BART will post signs early next week to alert riders they are required to wear face coverings.
CDC recommends wearing cloth face coverings that can be fashioned from household items or made at home from common materials. The cloth face coverings recommended are not surgical masks or N-95 respirators. Those are critical supplies that must continue to be reserved for healthcare workers and other medical first responders, as recommended by current CDC guidance.
The impact of these orders on BART employees and contractors include:
- Employees and contractors must wear mask/ coverings when:
- in any BART facility
- in any BART parking lot or garage
- in any train (in or out of service)
- in any District vehicle with others
- Masks/ coverings are not required but must be readily available (around neck or in pocket) and can be quickly put on if someone enters the room or workspace in these situations:
- in nonpublic office alone
- in a breakroom alone
- on the right of way, including yards and local control, where social distancing is observed (six-foot separation)
The new order does not replace the counties’ stay-at-home health order or the need to maintain physical distancing, wash hands frequently and cover coughs and sneezes – all fundamental to reducing the spread of COVID-19.
The District has distributed N95 and surgical masks to certain specified employees and will distribute surgical or cloth masks to all employees as required to comply with the health order. Any employee who would prefer to wear their own face covering is welcome to do so.
Updated at 4:15pm April 17, 2020
Beginning Monday, April 27, 2020, service on all 13 Early Bird Express (EBX) bus routes will be reduced or discontinued until further notice due to decreased ridership during shelter-in-place orders. In mid-March, the network carried roughly 1,000 riders per day. Today, that number has dropped to between 100 and 150 riders, an 85-90% decline in ridership.
Since the shelter-in-place order was established, BART and its seven partnering bus agencies have been working to monitor ridership trends, evaluate potential service options, and craft a data-driven service plan. EBX service needs to be reduced to match demand, save costs and support our transit partners in maintaining reliable service based on staffing levels. Partner bus agencies have also indicated that EBX service reductions are needed to free up their overall service capacity to sustain their core routes.
The following routes will continue running with the number of daily trips reduced:
- 701 (Pittsburg/Bay Point Station to Salesforce Transit Center)
- 702 (Pleasant Hill Station to Salesforce Transit Center)
- 704 (El Cerrito Del Norte Station to Salesforce Transit Center)
- 705 (MacArthur Station to Salesforce Transit Center via 19th St./Oakland Station
- 706 (Bay Fair Station to Salesforce Transit Center via Fruitvale Station)
- 713 (Salesforce Transit Center to San Francisco International Airport Station)
- 714 (Salesforce Transit Center to Daly City Station)
The following routes will be discontinued:
- 703 (Dublin/Pleasanton Station to Salesforce Transit Center)
- 707 (Fremont Station to Salesforce Transit Center)
- 708 (El Cerrito Del Norte Station to 19th St./Oakland Station)
- 709 (Antioch Station to Pittsburg/Bay Point Station)
- 712 (Pittsburg/Bay Point Station to 19th St./Oakland Station)
- 715 (North Concord Station to Pleasant Hill Station)
Click here to view a detailed PDF outlining all changes and alternative travel options
BART staff will conduct in-person outreach on Monday, Tuesday and Wednesday (April 20-22) at the Salesforce Transit Center and at 19th St./Oakland Station. Signage will also be posted at all EBX departure stations informing riders about the changes. Phone operators at BART's Transit Information Center are also available Monday-Friday, 8 am-6 pm at 510-465-BART (2278) to assist with planning travel.
Updated at 9:00am April 17, 2020
BART ridership for Thursday April 16 was 23,779 representing a 94% drop when compared to April ridership budget projections.
On Thursday the city of San Francisco barricaded the plazas at 16th and 24th Street Mission stations to prevent social gatherings. The stations remain open while the plazas are barricaded.
The MTC will consider initial distribution to Bay Area transit operators of CARES Act funding next Wednesday, April 22. The complete agenda and packet materials for the Commission meeting are now posted on the MTC website at www.mtc.ca.gov. The proposed initial allocation for BART is $251.6 million.
On Thursday, April 16, the Legislature began its formal process of considering how to budget for and respond to the COVID-19 pandemic, with a hearing of the Senate’s Special Budget and Fiscal Review Subcommittee on COVID-19 Response. BART General Manager Bob Powers submitted this letter to the subcommittee outling COVID-19 impacts to BART.
Updated at 8:00am April 16, 2020
BART ridership for Wednesday April 15 was 24,498 representing a 94% drop when compared to April ridership budget projections.
Updated at 5pm April 15
BART will join transit agencies across the United States in a singular show of appreciation for transit workers as public transportation vehicles will blow their horns.
On Thursday, April 16, at noon Pacific Time, BART trains will #SoundTheHorn in unison with transit agencies across the country, such as AC Transit, New York City Subway and Amtrak. The horns will be blown to honor the hard-working and essential public transit employees who continue to move people to their destinations during the current COVID-19 pandemic. Read the announcement.
Updated at 11:15am April 15, 2020
BART ridership for Tuesday April 14 was 23,890 representing a 94% drop when compared to April ridership budget projections.
Updated at 9:00am April 14, 2020
BART ridership for Monday April 13 was 24,271 representing a 94% drop when compared to April ridership budget projections.
Updated at 9:00am April 13, 2020
BART ridership for Sunday April 12 (Easter holiday) was 11,292 representing a 92% drop when compared to April ridership budget projections.
Today is the first day of temporary closures of some entrances in downtown San Francisco and additional entrance closures in downtown Oakland.
Updated at 10:15am April 12, 2020
BART ridership for Saturday April 11 was 11,292 representing a 93% drop when compared to April ridership budget projections.
BART ridership for Friday April 10 was 24,401 representing a 94% drop when compared to April ridership budget projections.
Updated at 10:20am April 10, 2020
BART ridership for Thursday April 9 was 24,688 representing a 94% drop when compared to April ridership budget projections.
Starting Monday April 13, BART will temporarily close several entrances at the four downtown San Francisco stations as well as additional entrances at the 12th & 19th Street stations in Oakland. The closures will help us focus our cleaning efforts and to improve safety for our employees and riders during times of record low ridership and the COVID-19 pandemic.
Downtown San Francisco station details:
All entrances on the north side of Market Street will remain open, while all entrances on the south side of Market will be closed. We prioritized the north of Market Street entrances after careful analysis of a number of factors including where the majority of riders are currently entering and exiting, ADA access, and known hot spots for illegal behavior. The north side of Market is where the elevators are located
Downtown Oakland station details:
The 12th Street Station will be accessible from the Williams Plaza and De Lauer’s News Stand at the center of the station, and 11th and Broadway (south end of station near the Marriott).
The 19th Street Station will be accessible from 17th and 20th Streets on the south side of Broadway.
All stations remain ADA accessible and signs in multiple languages will be posted at the closed entrances noting others remain open to avoid confusion.
Updated at 8:45am April 9, 2020
BART ridership for Wednesday April 8, the first day of 30 minute train frequency, was 25,507 representing a 94% drop when compared to April ridership budget projections. 871 fewer riders rode Wednesday compared to Tuesday.
The BART Board of Directors holds its regular board meeting today at 9am. The virtual meeting will be streamed live on our website at https://www.bart.gov/about/bod/multimedia
The Board will get an update on COVID-19 efforts and impacts. View the presentation.
Updated at 1:15pm April 8, 2020
Ridership data from this morning’s commute shows social distancing was possible on all trains. Station entry data shows the busiest train was the train that left the Pittsburg Transfer Platform on the Antioch to SFO line at 6:45am. By the time the train reached 19th Street Station there was an average of 20 people on board each car. It dropped to 17 at Embarcadero, 13 at Montgomery, and 10 at Powell. BART had previously determined and reported to the Board of Directors that social distancing can be achieved with an average of 26 people per car on our legacy fleet and 32 people per car on the Fleet of the Future. BART is running long trains and riders should spread out and use all cars. If a car seems too crowded to achieve social distancing, move to another car.
Here is a look at the average people per car data on our busiest line (Antioch to SFO) this morning. It shows this line had an average of 1-20 riders per car during the morning commute.
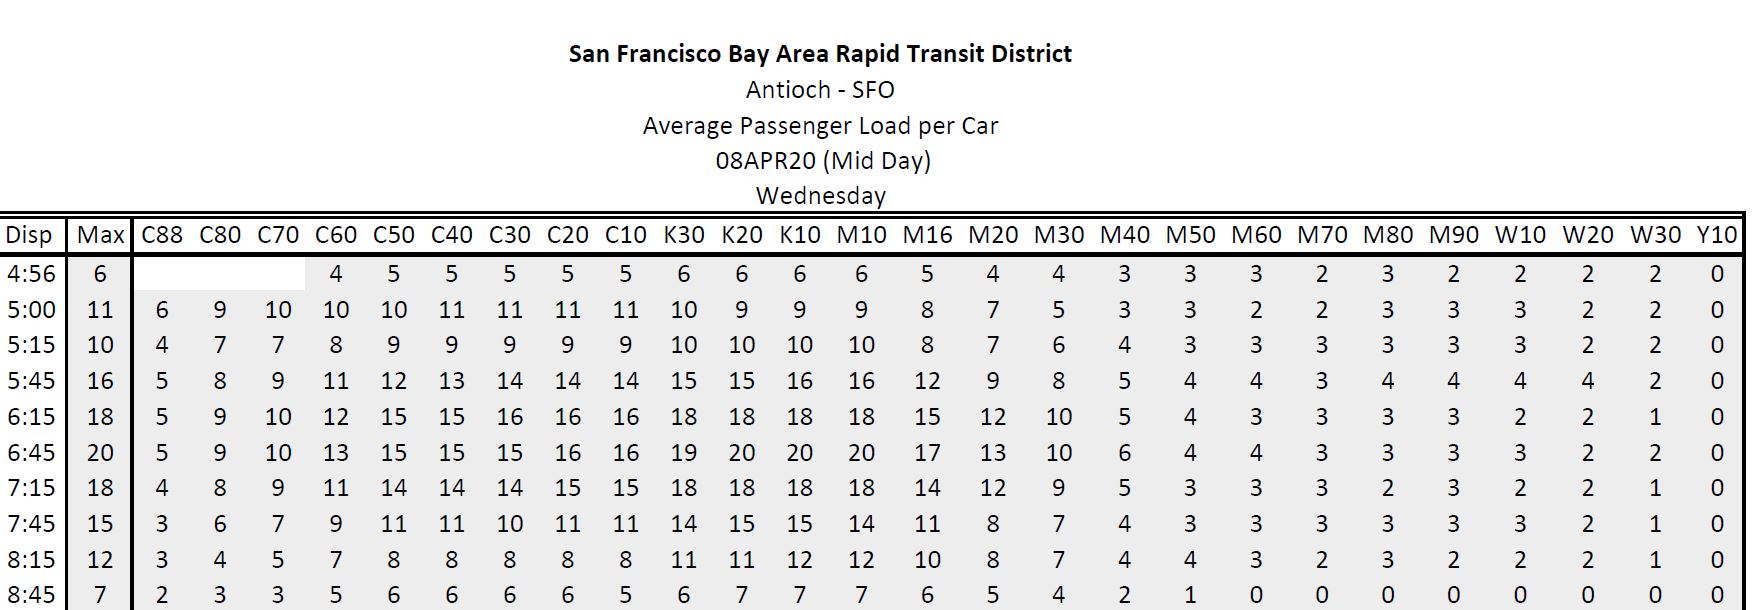
Other lines had far fewer riders.
- The Dublin Pleasanton to Daly City (Blue) line had an average of 3-14 riders per car during the morning commute.
- The Richmond to Warm Springs (Orange) line had an average of 3-10 riders per car.
- The Richmond to Millbrae (Red) line had an average of 3-9.
- The Warm Springs to Richmond (Orange) line had an average of 4-10.
- The Warm Springs to Daly City (Green) line had an average of 4-13.
Updated at 9:40am April 8:
BART ridership for Tuesday, April 7, 2020 was 26,378 representing a 93% drop when compared to April ridership budget projections. Today is the first day of trains running every 30 minutes. 26 trains are running systemwide at any one time (we usually run 56 trains during the peak commute time). All trains are long and announcements are being made to remind riders to spread out to maintain social distancing.
Updated at 9:15am April 7, 2020
BART ridership for Monday, April 6, 2020 was 24,909 representing a 94% drop when compared to April ridership budget projections.
Update at 3:50pm April 6, 2020
Starting Wednesday, April 8, Monday-Friday service will run every 30 minutes systemwide all day, with 3-line service beginning earlier in the evening and single tracking in San Francisco starting at around 8pm. Effectively, every other train is being cancelled Monday-Friday.
Weekend service will remain unchanged at this time.
The online Trip Planner has been updated. PDFs of the new schedule have been posted on the Schedule .pdfs page.
Updated at 9:20am April 6, 2020
BART ridership for Sunday, April 5, 2020 was 7,835 representing a 92% drop when compared to April ridership budget projections.
The BART Board of Directors will hold its regular board meeting on Thursday, April 9th at 9am. The virtual meeting will be streamed live on our website at https://www.bart.gov/about/bod/multimedia
The Board will get an update on COVID-19 efforts and impacts. View the presentation.
We strongly encourage public comments to be submitted via email. You may submit comments via email to [email protected], using “public comment” as the subject line. Your comment will be read into the record and will become a permanent part of the file. Please submit your comments as far in advance as possible. Emailed comments must be received before 9:00 a.m. in order to be included in the record. For those who cannot watch the Board Meeting live at bart.gov, you may listen to the Meeting by calling 1 888-204-5987 and entering access code 6866418.
Updated at 4:24pm April 5, 2020
BART ridership for Saturday, April 4, 2020 was 11,430 representing a 93% drop when compared to April ridership budget projections.
Updated at 11am April 4, 2020
BART ridership for Friday, April 3, 2020 was 28,965 representing a 93% drop when compared to April ridership budget projections.
This weekend we are taking advantage of low ridership to do extra track work. By increasing essential rebuilding projects we can also save our operating budget by shifting crews to focus on capital budget funded projects.
Saturday: Cable replacement between Orinda and Lafayette all day (Upon expedited request).
Sunday: Cable replacement between Embarcadero and 24 Mission until ~7pm.
Sunday: Track resurfacing between Union City and South Hayward all day.
Updated at 10am April 3, 2020
BART ridership for Thursday, April 2, 2020 was 28,649 representing a 93% drop when compared to April ridership budget projections.
BART ridership data for March 2020 has been uploaded at https://www.bart.gov/about/reports/ridership. Monthly ridership data and daily ridership data that is station specific, including origin and destination pairs are available for public access.
Updated at 1:20pm April 2, 2020
BART ridership for Wednesday, April 1, 2020 was 29,896 representing a 93% drop in ridership. New April ridership baselines have been established for weekdays and weekends based on what April ridership was budgeted to be.
BART has now posted new signage at entrances of all stations and all employee work locations districtwide to comply with new shelter in place orders. The posters included the mandated language outlined in the orders and a social distancing protocol that outlines the measures taken to protect employee health, maintain social distancing, and sanitization efforts.
View the poster and the protocol document.
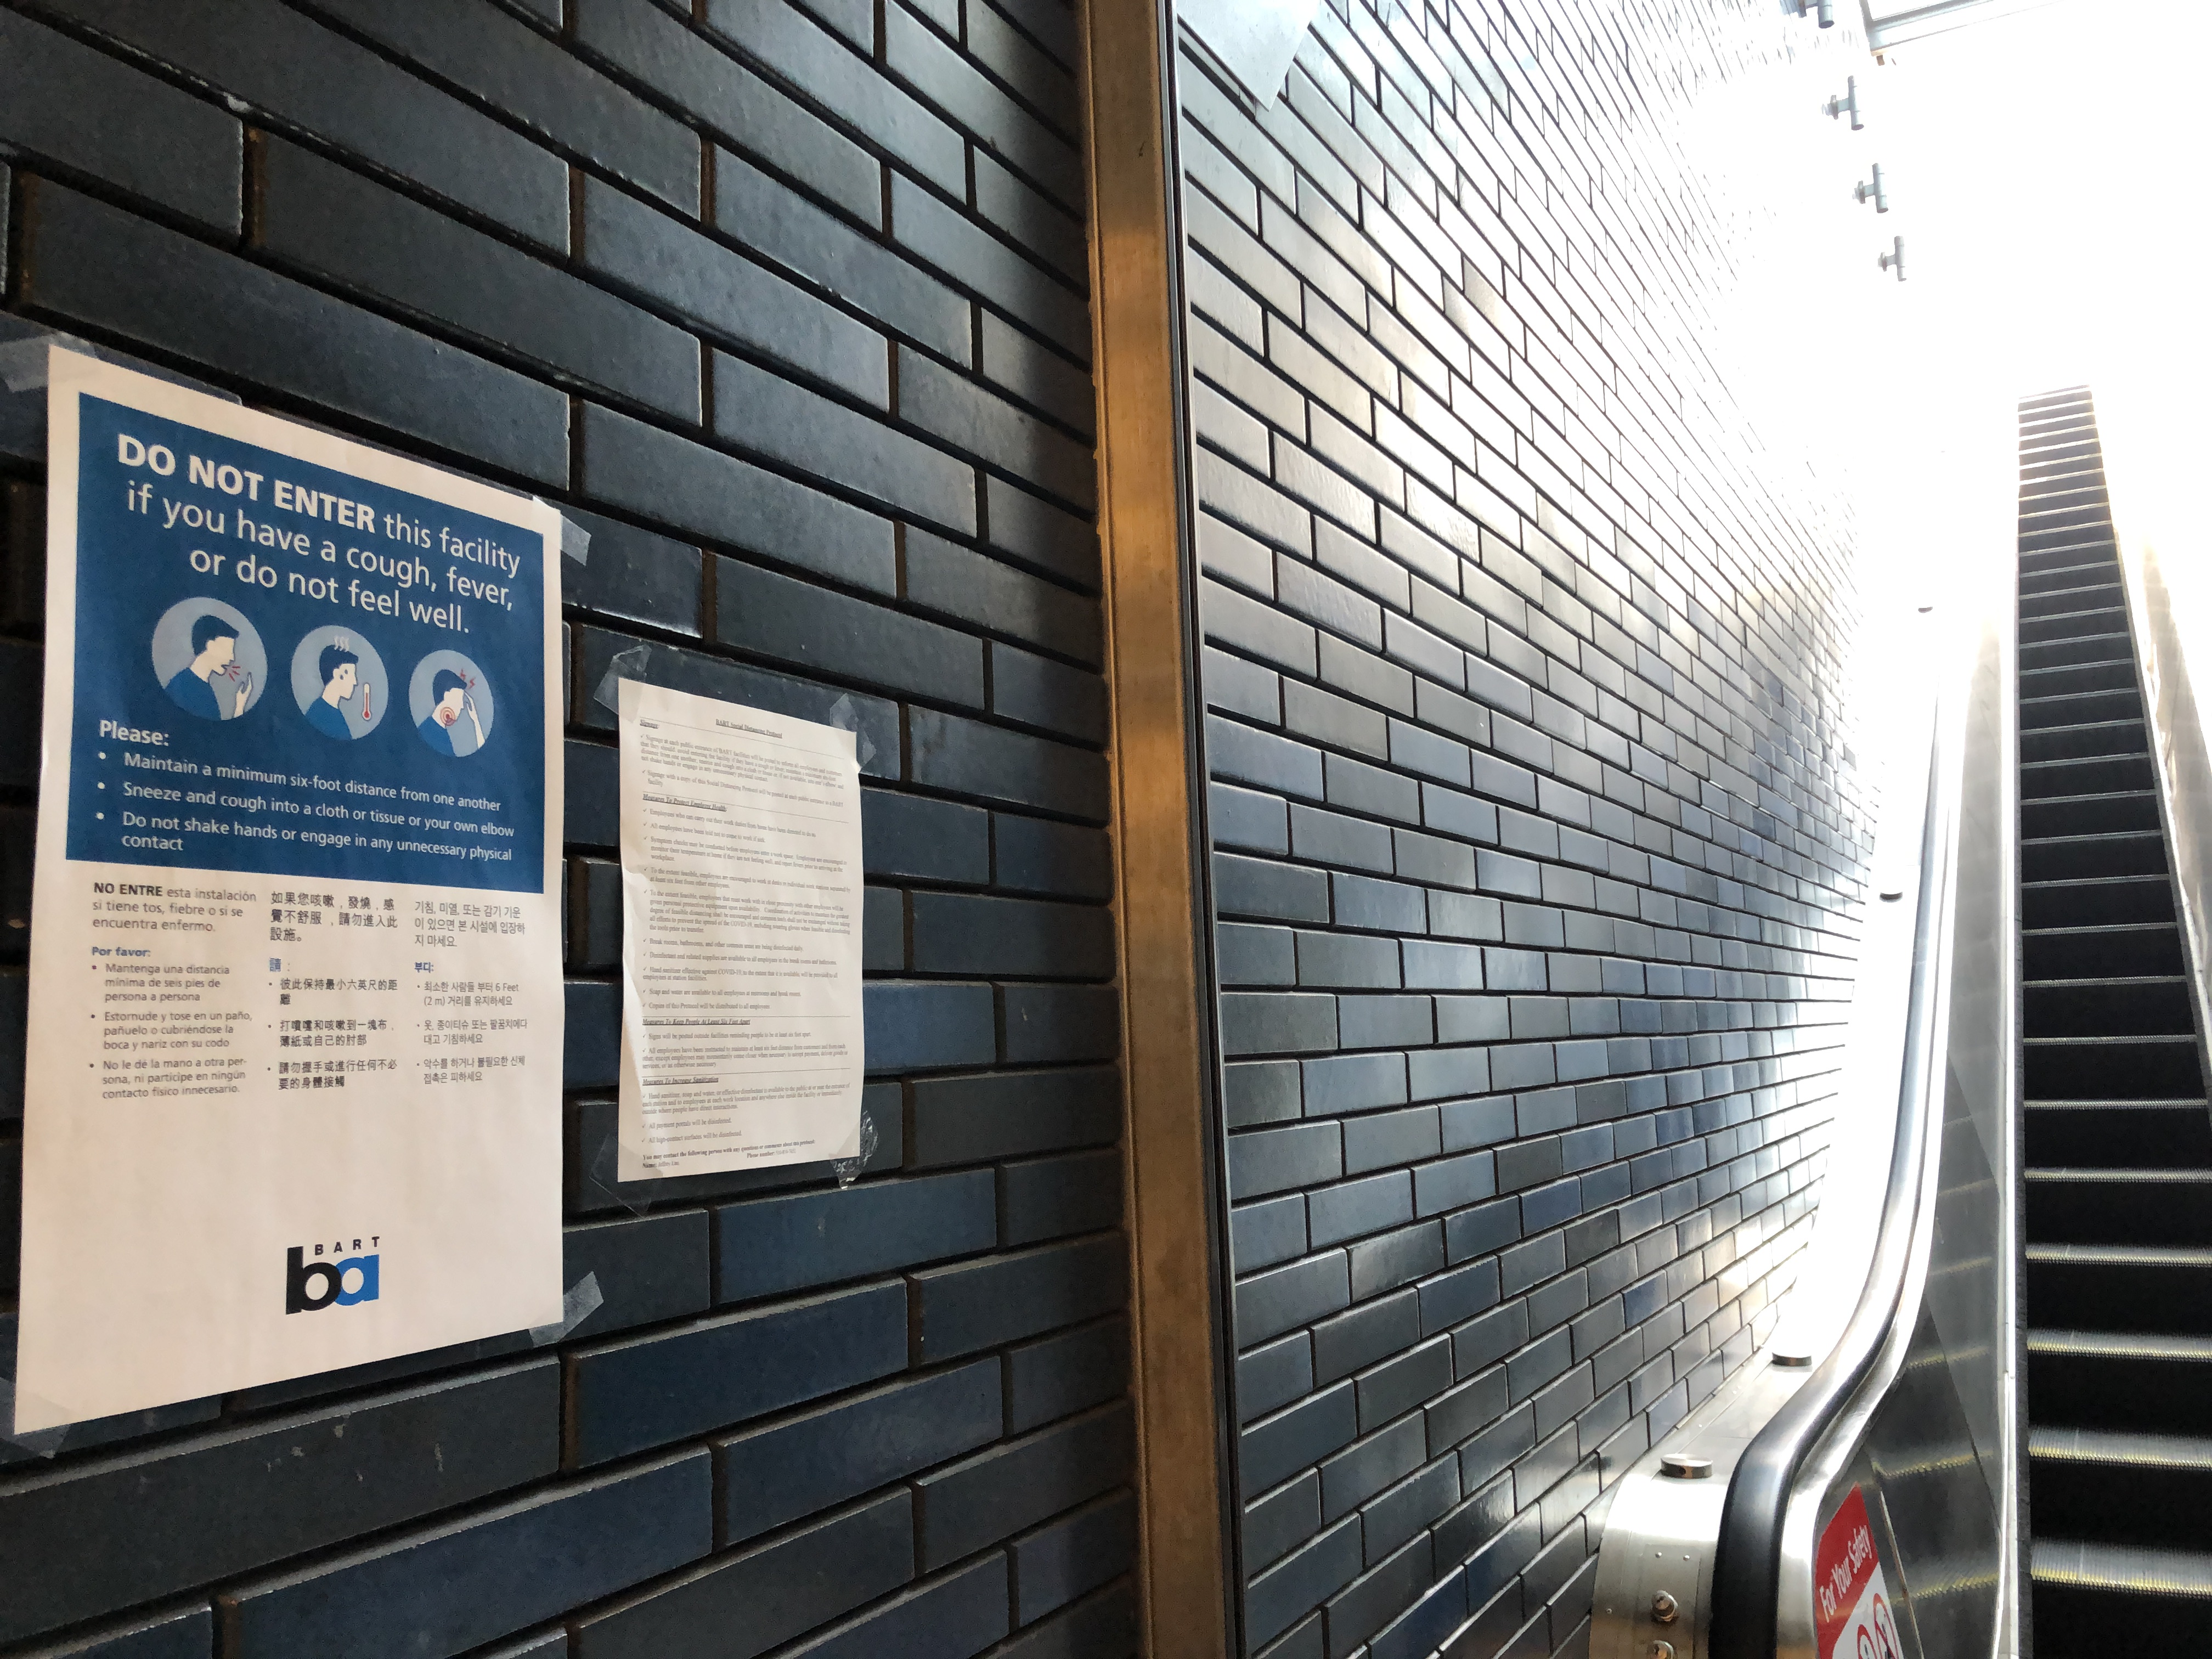
Updated at 1:20pm April 1, 2020
BART ridership for Tuesday, March 31, 2020 was 28,877, representing a 93% drop compared to an average Tuesday in February 2020 (see our chart above). Starting tomorrow, new baselines will be established for April comparisons since ridership expectations vary month by month.
While the new shelter in place orders have a section about construction, they do allow for BART to continue work on essential capital projects during the shelter in place orders.
Updated at 9:15am March 31, 2020
BART ridership for Monday, March 30, 2020 was 29,584, representing a 93% drop compared to an average Monday in February 2020 (see our chart above).
Starting March 31, BART is closing secondary station entrances at 12th Street Oakland City Center and 19th Street Oakland stations to help focus our cleaning efforts and to improve safety during times of low ridership.
At 12th Street Station, the following entrances are closed:
- Broadway and 14th St north end
- Street Access to Wells Fargo on Broadway
- 13rd and Broadway, near the now-closed Burger King
- 11th Street south end
At 19th Street Station, the following entrances are closed:
- 1930 Broadway center of station
- Previously closed 1733 Broadway south end
- 1955 Broadway (Uptown Station) north end
BART closed the following station entrances prior to March 31:
- Balboa Park north end
- Powell north long corridor
- Downtown Berkeley south end
Updated at 9:30am March 30, 2020
BART ridership for Sunday, March 29, 2020 was 9,453, representing a 90% drop compared to an average Sunday in February 2020 (see our chart above).
To help ease our operating budget, this past weekend we sent some escalator and elevator crews to the Milpitas Station for some prep work, which is paid for with the capital budget.
BART continues to use the downtime from shelter in place and recent 9pm service closure to help rebuild its system. For more information, visit here.
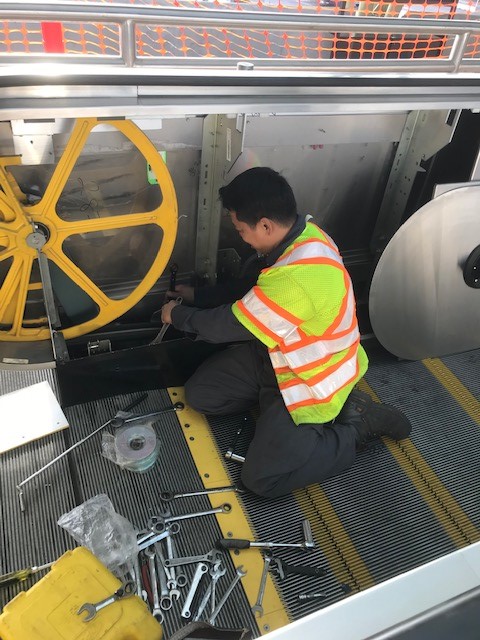
Updated at 11:30am March 29, 2020
BART ridership for Saturday, March 28, 2020, was 12,389, representing a 92% drop compared to an average Saturday in February 2020 (see our chart above).
Crews continue our home improvement projects during this time of very low ridership and to take advantage of closing at 9pm. Pictured below is a crew member getting access to the platform earlier than usual to do electrical work. New LED lighting is being installed throughout the station.
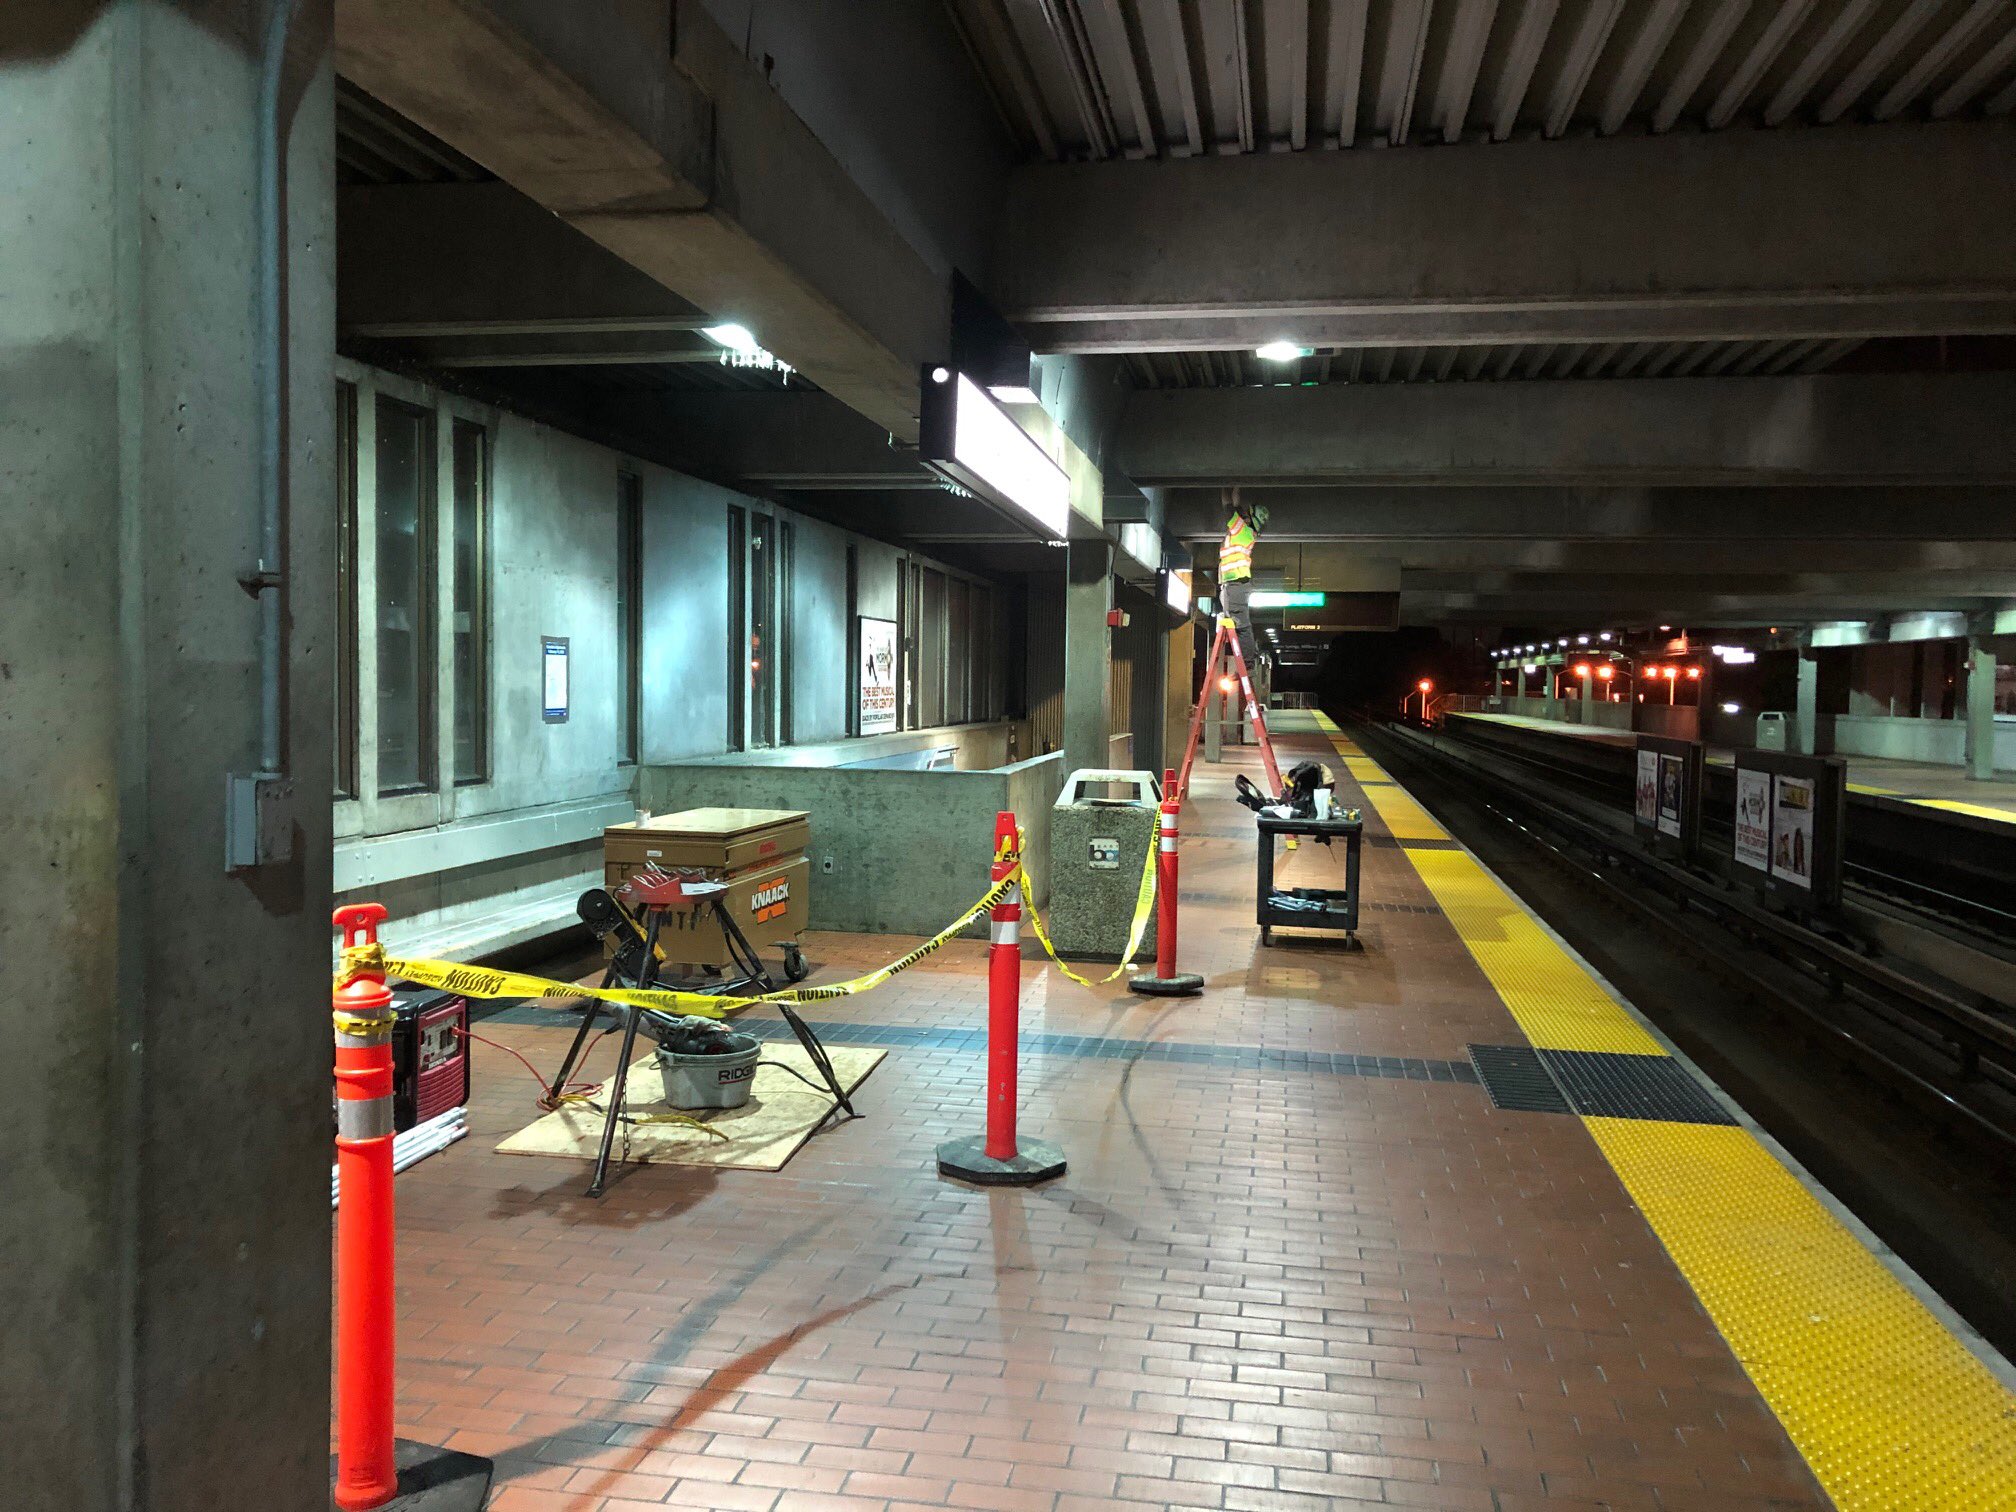
Updated at 10:30am March 28, 2020
BART ridership for Friday, March 27, 2020, was 31,142, representing a 92% drop compared to an average Friday in February 2020 (see our chart above).
Updated at 8:45am March 27, 2020
BART ridership for Thursday, March 26, 2020, was 31,601, representing a 92% drop compared to an average Thursday in February 2020 (see our chart above).
During this time of extreme low ridership, BART continues many of its capital projects to help rebuild its system.
Crews recently demolished the long-closed restroom at 19th St station as we work to remodel the restroom and re-open it. It's part of the station's modernization project.
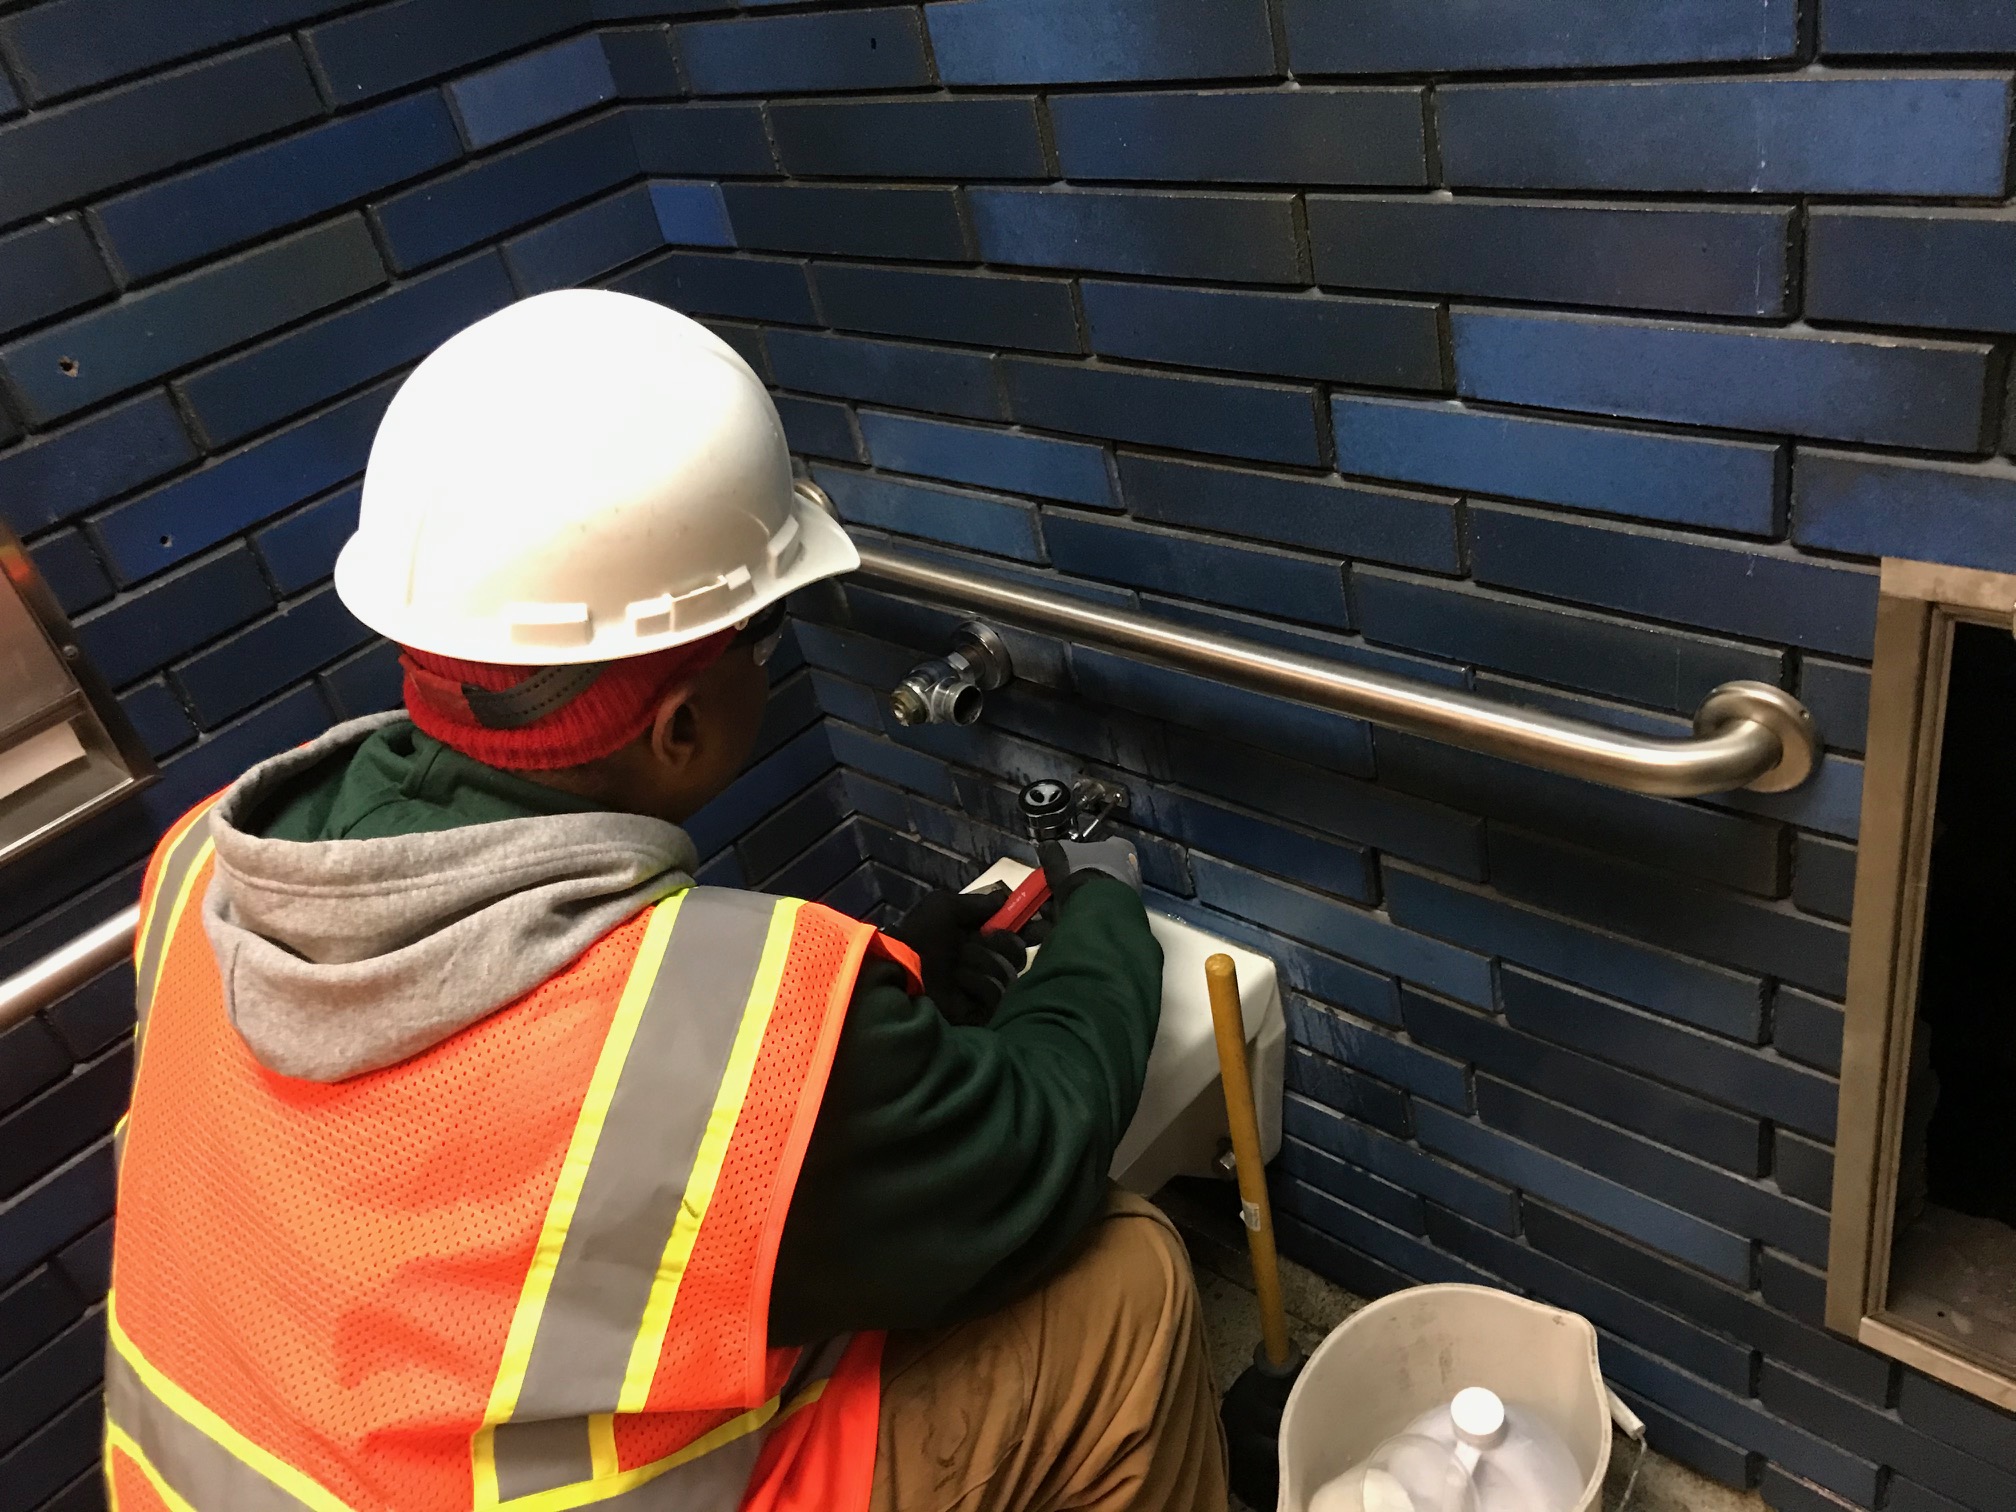
Capital projects are not paid for by operating funds, meaning our 90% ridership dip and related huge revenue loss isn't impacting planned capital projects.
Capital project workers, including contractors who are working on the 19th St restroom, are maintaining social distancing at work.
BART is utilizing this period of extreme low ridership to get work done. Certain major capital projects will benefit from service closure at 9pm, like: 19th Street Station Modernization; El Cerrito del Norte Station Modernization; Rail Grinding; Rail Replacement; and Transbay Tube Cathodic Protection.
Updated at 2:55pm and 8am March 26, 2020
BART ridership for Wednesday, March 25, 2020, was 32,625, representing a 92% drop compared to an average Wednesday in February 2020 (see our chart above).
The estimated loss revenue impact for March-to-date (through 3/25) is -$17,495,000, and a loss of 4.172M trips. Projections for the full month of March is a loss of $24,663,000 with a loss of 5.878M trips.
BART budget staff is waiting to find out how much money BART will receive from the federal stimulus package to help support our operating budget and running service. There will be approximately $1.3B provided to the MTC to divide up among Bay Area transit operators.
Updated at 9:25am March 25, 2020
BART ridership for Tuesday, March 24, 2020, was 32,117, representing a 92% drop compared to an average Tuesday in February 2020 (see our chart above).
Read the statement from BART General Manager Bob Powers on $25 billion in transit funding included in Senate bill to be voted on.
Special BART Board meeting held to 3/26 to discuss COVID-19
BART Board President Lateefah Simon called a Special Meeting of the Board of Directors on Thursday, March 26, 2020, at 9:00 a.m. Pursuant to Governor Newsom’s Executive Order N-25-29 and the California Shelter-in-Place mandate, which prevents all but essential travel, public participation for this meeting will be via teleconference only. To listen to the Special Board Meeting, please dial 1-888-204-5987 and enter access code 6866418.
We strongly encourage public comments to be submitted via email. Please send comments on Item 3 only to [email protected], using “Public Comment” as the subject line. Your comment will be read into the record and will become a permanent part of the file. Please submit your comments as far in advance as possible. Emailed comments must be received before 9:00 a.m. in order to be included in the record.
Individuals may also be given an opportunity by the moderator to speak during the Public Comment section of the meeting. Public comments will be limited to three (3) minutes per person.
View the presentation that will be given.
Updated at 9:20am March 24, 2020
BART ridership for Monday, March 23, 2020 was 34,933, representing a 91% drop compared to an average Monday in February 2020 (see our chart above).
Last night's 9pm closure was without incident. The "grand meet" which is when the last trains of the evening all meet at MacArthur to ensure riders transfer to the last train home occurred at 9:52pm.
SFO is offering a free shuttle between some of our stations and the airport after 9pm. Read the flyer for full details.
AC Transit has created a special page outlining station by station bus options after 9pm. The page provides alternative routes from inner East Bay BART stations to and from San Francisco, downtown Oakland, and downtown Berkeley between 9:00 p.m. and midnight: http://www.actransit.org/bus-alternatives-for-inner-east-bay-bart-stations-between-900-p-m-and-midnight/
Updated at 9:45am March 23, 2020
BART ridership for Sunday, March 22, 2020 was 12,737, representing a 87% drop compared to an average Sunday in February 2020 (see our chart above). 24,269 fewer riders rode on Sunday compared to the previous Sunday before the shelter in place order was made.
Today BART General Manager Bob Powers joined other transit leaders across the nation in sending a letter to Senate and House leadership requesting that any federal relief package include at least $25 billion of dedicated support for public transportation agencies.
Updated at 10:20am March 22, 2020
BART ridership for Saturday, March 21, 2020, was 18,793, representing a 87% drop compared to an average Saturday in February 2020 (see our chart above). 39,394 fewer riders rode on Saturday compared to the previous Saturday before the shelter in place order was made and 94,595 fewer than 2 Saturdays ago.
BART ridership for Friday, March 20, 2020 was 42,461, representing a 89% drop compared to an average Friday in February 2020 (see our chart above). 11,570 fewer riders rode on Friday compared to Tuesday which was the first full day of the shelter in place order.
BART staff has updated this Fact Sheet outlining revenue loss figures based on the latest ridership data. A sustained ridership loss of 90% and a 50% reduction of economic activity impacting other revenue sources could reduce BART's monthly revenues by $57M.
Updated at 9:15am March 20, 2020
BART ridership for Thursday, March 19, 2020 (the third full day of the shelter in place order) was 45,915, representing a 89% drop compared to an average Thursday in February 2020 (see our chart above). 8,116 fewer riders rode on Thursday compared to Tuesday which was the first full day of the shelter in place order.
Starting Monday, March 23, 2020, BART will provide service Monday-Friday from 5am-9pm (currently service is 5am-midnight). Current weekday train frequency will remain.
Starting Saturday March 28, 2020, Saturday and Sunday service will be from 8am-9pm (currently Saturday service is 6am-midnight and Sunday is 8am-midnight). Current weekend train frequency will remain.
For riders impacted by the service hour changes, BART staff continues to update the Trip Planner www.bart.gov/planner to cancel trains after 9pm and before 8am on Saturday so riders may plan accordingly and ahead.
Cancelled BART trains will show on the Trip Planner with a red strikethrough on its time of arrival and message "This trip is cancelled. Due to low ridership as a result of the COVID-19 shelter in place order, this trip is cancelled until further notice." The Trip Planner will show other public transit alternatives available.
On the Trip Planner, riders can plug in their home address, work address or their next destination to find the most transit-friendly route. Riders have ability to combine other modes such as walking, bicycling and driving into their itinerary. Riders can plan hours and days ahead of their planned trip using the BART Trip Planner.
Updated at 2:20pm March 19, 2020
BART to temporarily reduce service hours based on ridership data
Announced on Monday April 6: Starting Wednesday, April 8, Monday-Friday service will run every 30 minutes systemwide all day, with 3-line service beginning earlier in the evening and single tracking in San Francisco starting at around 8pm. Effectively, every other train is being cancelled Monday-Friday. Weekend service will remain unchanged at this time.
Read the full announcement.
The online Trip Planner has been updated. PDFs of the new schedule have been posted on the Schedule .pdfs page.
Announced on March 19:
BART has done an exhaustive review of ridership and train car loads this week and will make the following changes to service until further notice:
Starting Monday, March 23, 2020, BART will provide service Monday-Friday from 5am-9pm (currently service is 5am-midnight). Current weekday train frequency will remain.
Starting Saturday March 28, 2020, Saturday and Sunday service will be from 8am-9pm (currently Saturday service is 6am-midnight and Sunday is 8am-midnight). Current weekend train frequency will remain.
All riders must be in the system by 8:45pm to have a guaranteed ride to their destination.
BART will monitor ridership data each day to determine how long these service hours will be in effect.
SFO is offering a free shuttle between some of our stations and the airport after 9pm. Read the flyer for full details.
AC Transit currently offers late night transbay bus service.
AC Transit has created a special page outlining station by station bus options after 9pm. The page provideds alternative routes from inner East Bay BART stations to and from San Francisco, downtown Oakland, and downtown Berkeley between 9:00 p.m. and midnight: http://www.actransit.org/bus-alternatives-for-inner-east-bay-bart-stations-between-900-p-m-and-midnight/
Other systems the currently offer some level of service around BART's service area after 9pm:
- Capitol Corridor
- SFMTA
- Caltrain
- SamTrans
- County Connection
- Tri Delta Transit
Other agencies may be modifying service as well during the Shelter in Place order. Once you plan your alternative trip, please check the agency's website as their planned trip information may have changed as well.
Read the full announcement.
Updated at 9:10am March 19, 2020
BART ridership for Wednesday, March 18, 2020 (the second full day of the shelter in place order) was 48,085, representing a 88% drop compared to an average Wednesday in February 2020 (see our chart above). 5,946 fewer riders rode on Wednesday compared to Tuesday.
Updated at 3pm March 18, 2020
Starting Thursday March 19, BART will temporarily eliminate the extra commute trains that run during the AM and PM commute on the Yellow (Antioch-SFO) line until further notice. The regular base schedule of 15-minute headways during commute hours will remain systemwide. The trains being cancelled are the extra trains that provide more frequent service during our busiest hours on our busiest line. These trains are traditionally cancelled during periods of low ridership, such as the December holiday season.
Social distancing will remain possible on the yellow line all day. BART staff pulled data from Wednesday morning showing cars that make up the extra commute trains carried an average of 7 riders per car. Moving these riders to the base trains that run every 15 minutes will not cause crowding and riders will be able to maintain social distancing.
The Trip Planner and platform digital monitors will show the eliminated trains as “cancelled.”
Temporarily eliminating these extra trains during low ridership will reduce maintenance needs, allow for additional cleaning of the cars, and provide train operators to backfill vacancies.
Updated at 10am March 18, 2020
BART ridership for Tuesday, March 17, 2020 (the first full day of the shelter in place order) was 54,031, representing a 87% drop compared to an average Tuesday in February 2020 (see our chart above).
Updated at 4:15pm March 17, 2020
BART issued a press release today calling for emergency stimulus funds. Initial data for Tuesday’s commute shows an 85% decline. That level of decline will cost BART a loss of approximately $37M per month in fare and parking revenue. A sustained ridership loss of 85% and a 50% reduction of economic activity impacting other revenue sources could reduce BART's monthly revenues by $55M. (Update 3/22: with a 90% reduction this number grows to $57M)
We are also sharing this fact sheet (Fact sheet was updated on 3/22 click here to view latest version) about the financial impact of the pandemic and shelter in place orders. Last week letters were sent local, state, and federal officials about securing COVID-19 related emergency funds.
Updated at 9:00am March 17, 2020
BART ridership for Monday, March 16, 2020 was 118,572 representing a 70% drop compared to an average Monday in February 2020 (see our chart above).
BART is running regular service for essential workers during the shelter in place order. Trains are long to allow for social distancing. There was no crowding today during the morning commute, but trains did carry people, indicating there are essential workers who depend on transit. See below for details about the shelter in place order.
Updated at 2:20pm March 16, 2020
BART continues regular service during shelter in place
Today’s shelter in place emergency order from local counties considers BART as an essential business.
BART will continue to provide regular service for riders performing essential activities and for riders travelling to and from “essential business” work, with long enough trains to allow for social distancing. Based on ridership levels last week and over the weekend, social distancing is happening on BART. Last week BART served 24%-61% fewer riders depending on the day of the week. There is enough space for riders to remain 6 feet from each other. Increased cleaning and disinfecting are continuing in stations and trains.
The order provides the following guidelines specific to transit:
- BART, along with other essential businesses, is “strongly encouraged to remain open.”
- To the greatest extent feasible, BART should allow for Social Distancing of at least six feet from any other person including, but not limited to, when any customers are standing in line.
- People must use public transit only for purposes of performing Essential Activities or to travel to and from work to operate Essential Businesses or maintain Essential Governmental Functions and Essential Infrastructure operations and maintenance. People riding on public transit must comply with Social Distancing Requirements, to the greatest extent feasible. The shelter in place order defines each of those categories.
Essential travel also includes travel:
- to obtain necessary services or supplies for themselves and their family or household members.
- to engage in activities or perform tasks essential to their health and safety, or to the health and safety of their family or household members.
- to care for elderly, minors, dependents, persons with disabilities, or other vulnerable persons.
- to or from educational institutions for purposes of receiving materials for distance learning, for receiving meals, and any other related services.
- to return to a place of residence from outside the jurisdiction.
- required by law enforcement or court order.
- required for non-residents to return to their place of residence outside the County.
BART staff and frontline workers continue to deliver safe BART service. BART staff is being provided the tools they need to perform their job safely including hand sanitizer, germicidal wipes, face masks for positions that require them, and other personal protective equipment. We offer an Employee Assistance Program with resources that can assist with child/elder care referrals, financial consultation and counseling with a licensed mental health clinician.
If you are sick, we ask you not to ride BART. If your travel isn't essential, we ask that you follow the order and not ride BART.
The trains must continue to run to ensure lifeline service to those workers who will keep the region functioning during these trying times.
(Posted at 12:55pm March 16, 2020)
BART ridership for Sunday, March 15, 2020 was 37,006 representing a 61% drop compared to an average Sunday in February 2020 (see our chart above).
BART is running regular service today. With fewer riders and increased disinfecting, social distancing is possible and we are committed to regular service for those who rely on transit.
BART continues to provide ridership figures as we believe transparency is critical in times of emergency. The ridership figures show that people are staying home if they can, that there are people who still need to go to work in person and BART plays a critical role in moving them, that there is no crowding on trains and social distancing is possible, and we are committed to sharing as much information with the public as we can.
BART's Twitter poll asking riders their opinion about personal hand straps was available for voting until 2 pm Sunday. The final results are in: with 4,082 total votes on Twitter, 74.9% of the voters said yes to the personal hand strap idea. Other feedback from Facebook and Instagram showed similar levels of support for the personal hand strap. We will announce to the public if there are any new developments.
(Posted at 9:45am March 15, 2020 and updated with picture at 11:45am)
BART ridership for Saturday, March 14, 2020 was 58,187 representing a 61% drop compared to an average Saturday in February 2020 (see our chart above).
BART is running regular Sunday service with planned single tracking for cable replacement work. The single-tracking is between Embarcadero-24 Mission. Expect 10-15 min delays between Embarcadero- 24 Mission for most of the day. Blue Line will turn back at Montgomery. We are running 10 car trains through SF so riders can maintain space between each other. Platforms are not crowded. Here is a look at Montgomery at 11am today:
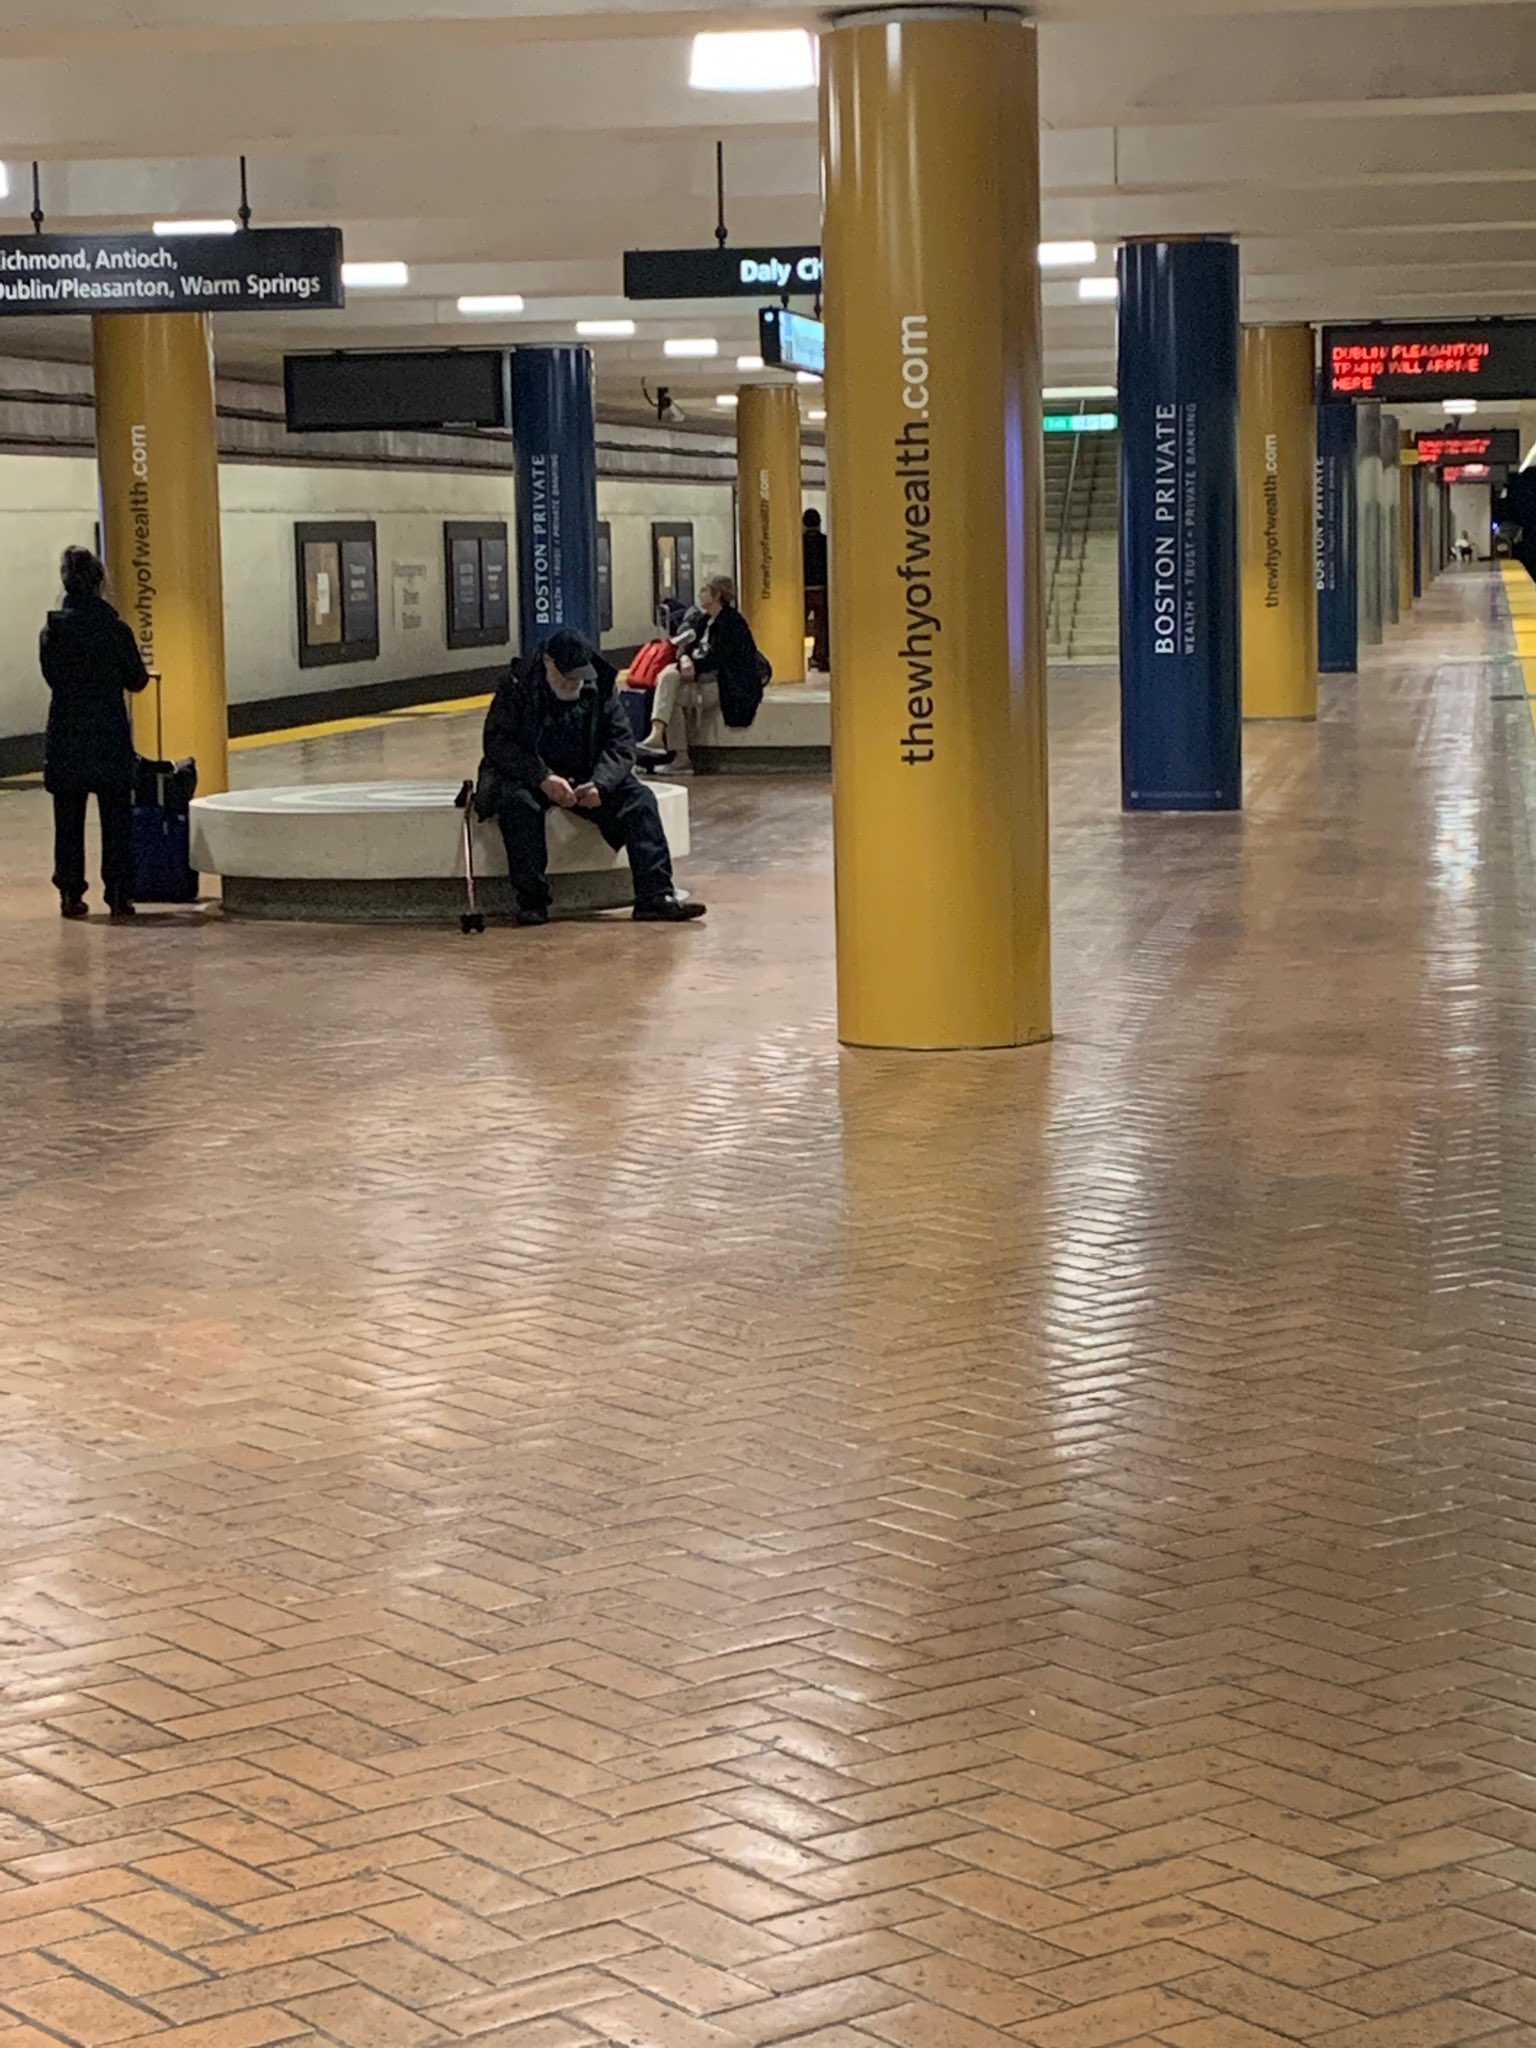
BART staff continues increased disinfecting and riders can maintain social distancing on stations, on platforms and inside trains due to lower ridership.
For the coming week, we will continue regular service with no planned service reductions. We expect further drops in ridership with school closures in effect throughout the region.
BART's Twitter poll asking riders their opinion about personal hand straps will be active until 2pm today. Currently more than 4,000 poeple have voted with 75% liking the idea. Watch the video and take the Twitter poll
Riders are encouraged to sign up for BART news at https://cloud.info.bart.gov/signup
(Updated 10:20am March 14, 2020)
BART ridership for Friday, March 13, 2020 was 184,605 representing a 50% drop compared to an average Friday in February 2020 (see our chart above).
BART is running regular weekend service with the following planned track work:
SAT: Single-tracking for Yellow Line after 11:30pm due to work in Berkeley Hills Tunnel.
SUN: Single-tracking between Embarcadero-24 Mission for cable replacement work. Expect 10-15 min delays between Embarcadero- 24 Mission for most of the day. Blue Line will turn back at Montgomery.
On Friday, General Manager Bob Powers filmed a video showcasing a prototype of a personal hand strap we are considering. Riders could take them home and clean it before use. We want to know if this is worthwhile before we order more. Watch the video and take the Twitter poll (the poll is open through Sunday morning).
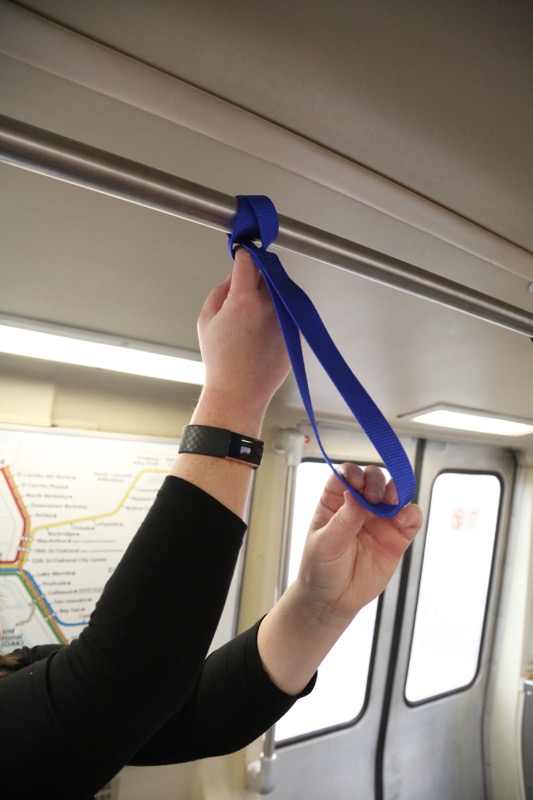
(Updated 9:20am March 13, 2020)
BART ridership for Thursday, March 12, 2020 was 231,820 representing a 45% drop compared to an average Thursday in February 2020.
BART continues to run regular service and we are not considering reduced service or a system shut down unless forced to do so. We've seen headlines and social media posts stating BART is considering reduced service or shutting down. We want our riders to know we plan to continue to run regular service and we will only reduce or close if the Governor or medical professionals direct us to.
There are also rumors of BART employees with COVID-19. We are unaware of any positive tests and employees are accounted for.
We have confirmed with staff that we have completed installing hand sanitizer dispensers at all stations.
(Updated 10:20am March 12, 2020)
BART ridership for Wednesday, March 11, 2020 was 268,192 representing a 35% drop compared to an average Wednesday in February 2020.
Today our General Manager provided an update to our Board of Directors about our prevention efforts. You can watch the update here once the board meeting has completed. (click on GM Report):
General Manager Powers confirmed that hand sanitizer dispensers began to be installed last night and as of today (Thursday March 12, 2020) BART has enough supply to last 7-10 days. Staff is working to purchase more and is in communication with vendors. Increased cleaning and disinfecting continues.
The Governor's call to cancel gatherings of 250 people or more includes an exemption for transit as it is an essential service. However, we want our riders to know, there is currently no crowding at BART and riders can remain an arm-lengths distance from others on trains and on our platforms.
Powers confirmed staff has emergency plans in place should there be a call to shut down or significantly reduce service; however, that is not anticipated at this time. Should there be a reduction in service, BART will communicate in real time with the public using email/text alerts, the BART website and the official app, social media, in-station announcements, posted signs, and through the news media. We have ensured layers of staffing trained to distribute information.
Riders are encouraged to sign up for BART Service Alerts via email or text and BART news at https://cloud.info.bart.gov/signup
(Updated 2:45pm March 11, 2020)
BART will deploy hand sanitizer to each station starting tonight. All 48 stations will have at least one dispenser mounted in the paid area of the station.
With less crowding, riders can maintain distance from each other. According to public health officials, maintaining an arms-length space between people will help prevent the spread of COVID-19.
BART ridership for Tuesday, March 10, 2020 was 292,011 representing a 30% drop compared to an average Tuesday in February 2020 (415,760).
Financial impact being assessed
Fewer riders means less revenue to BART. Currently 60% of our budget to provide service is from fare dollars. Dips in ridership are a serious financial concern. BART staff is assessing the financial impact, which at current ridership levels is estimated at approximately $450,000 to over $600,000 each weekday in fare revenue loss. Increased cleaning will also come with a price tag. In the coming days and weeks, BART will be actively pursuing emergency aid from local, state and federal sources to help keep our budget whole and deliver service.
Despite these financial challenges, BART is committed to continuing to provide reliable service and to be a vital part of the Bay Area’s response to the corona virus. BART is a critical lifeline for the many health care providers and others who rely on the system to get to and from work to maintain essential services.
(Updated 11am March 10, 2020)
BART ridership for Monday, March 9, 2020 was 301,547, representing a 25% drop compared to Monday, February 24, 2020 which had 403,002.
(Updated 9:30am March 9, 2020)
BART ridership for the work week of March 2-6, 2020 was down 8% compared to the previous week. The average ridership for the week was 380,000.
(This article was originally published Feb. 25, 2020)